Question 29
Kinetic Theory and States of MatterThe graph shows a typical heating curve from the solid phase through the liquid phase to the gaseous phase of a substance. Which part of the curve shows solid and liquid in equilibrium?
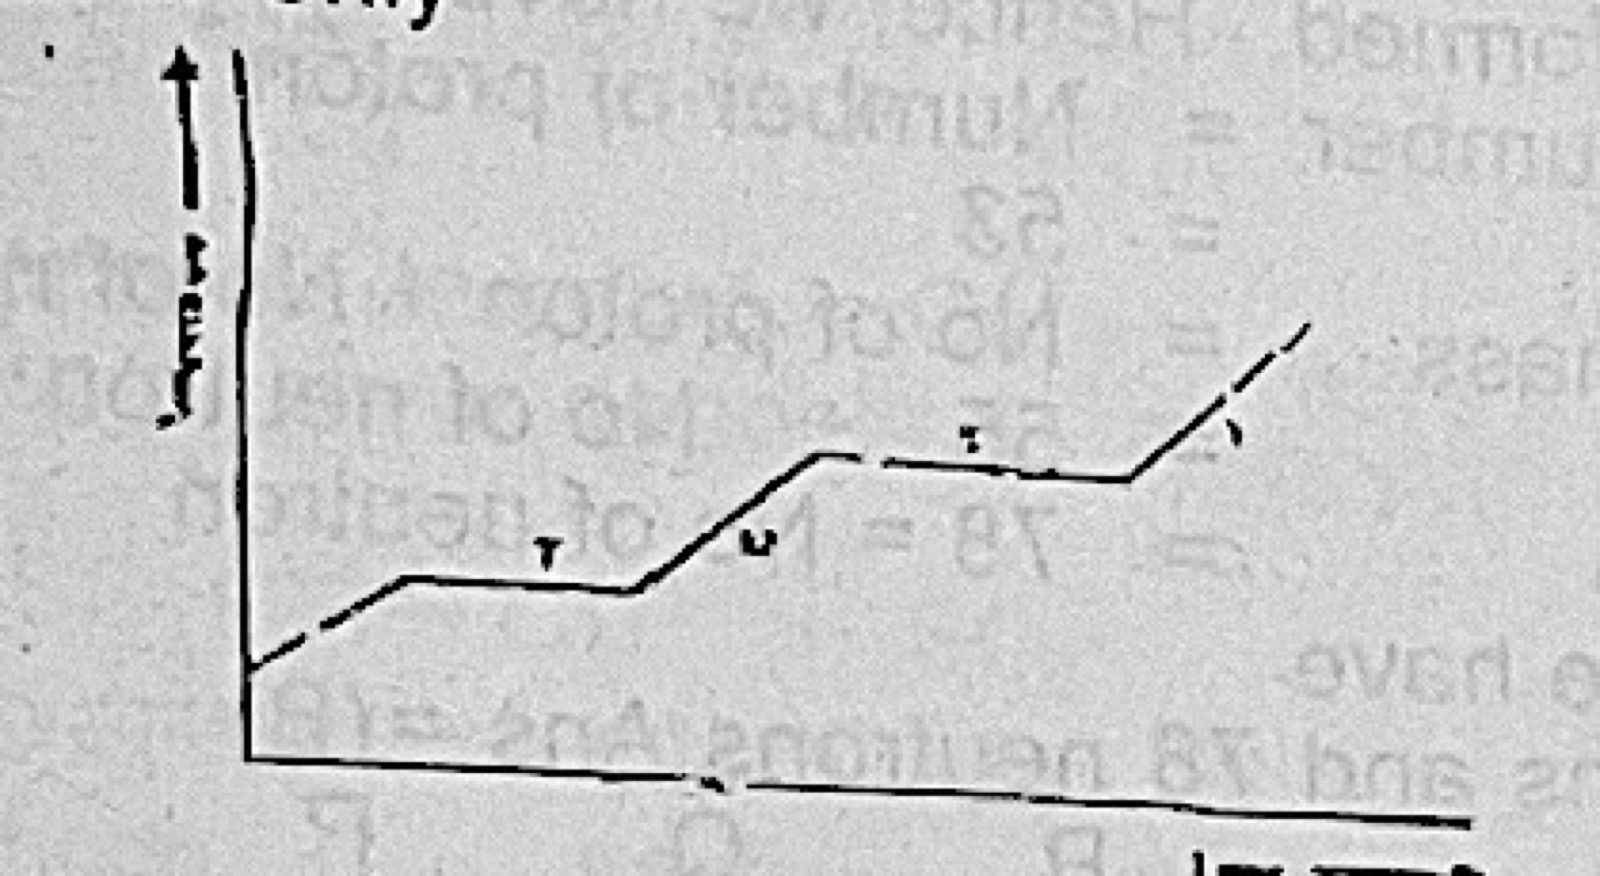
- A.T
- B.U
- C.X
- D.Y
Show the answer and explanation
Answer: A (T)
Explanation
While a solid melts, its temperature stays constant, giving the first flat part of the curve (T). There, solid and liquid exist together.