Question 6
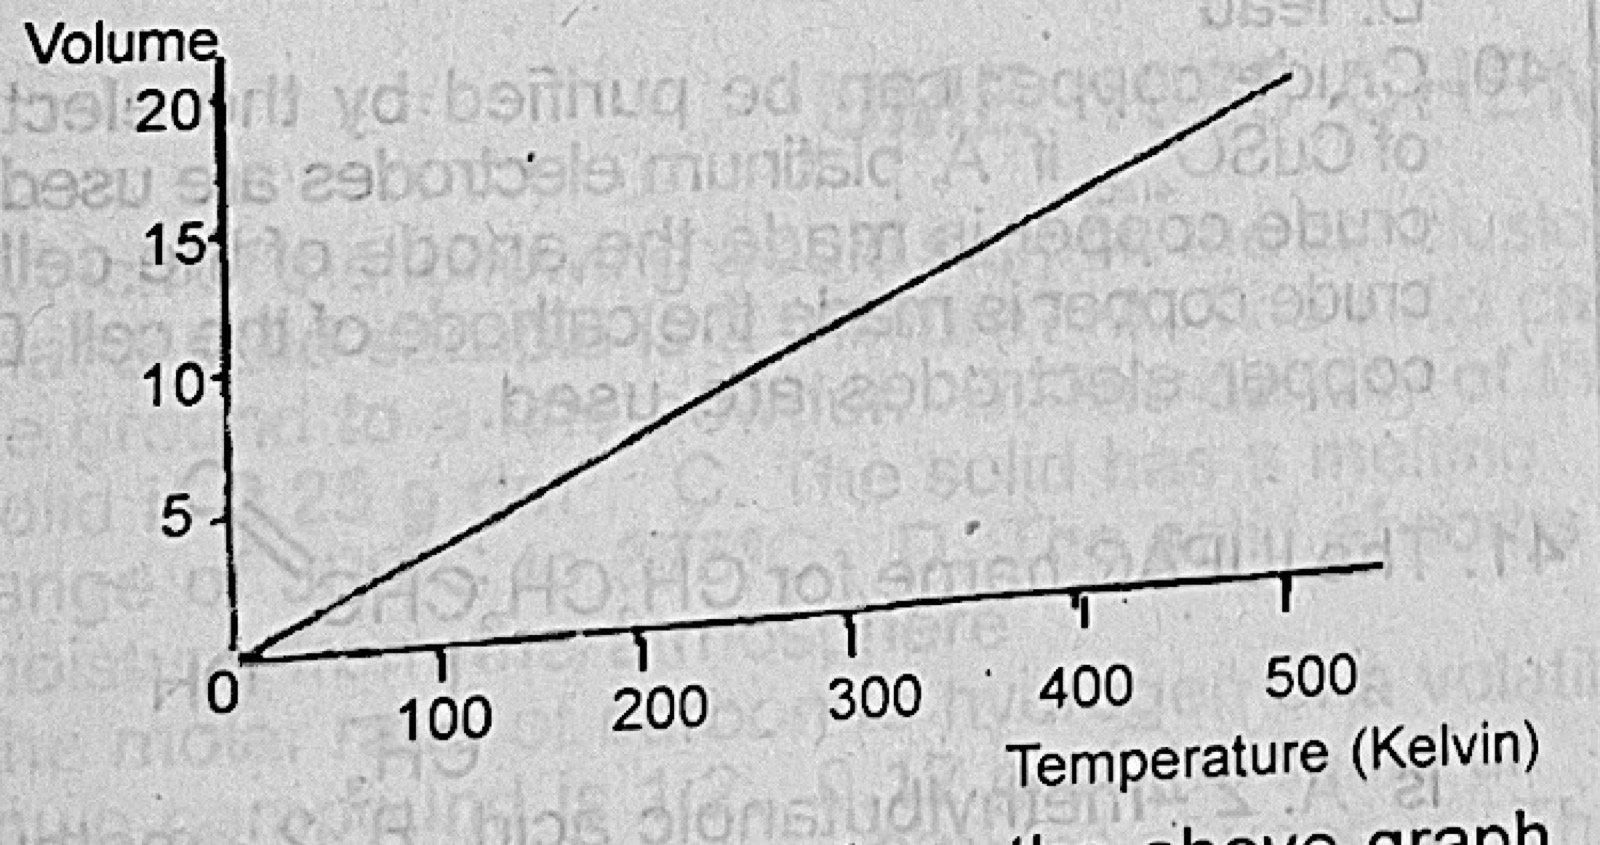
Gas LawsWhich of the gas laws does the graph of volume against temperature (Kelvin) shown illustrate?
- A.Boyle
- B.Charles
- C.Graham
- D.Gay-Lussac.
Show the answer and explanation
Answer: B (Charles)
Explanation
The graph is a straight line through the origin: volume is directly proportional to Kelvin temperature at constant pressure. That is Charles' law.