Question 7
Gas LawsWhich of the curves shown in Fig. 1 represents the relationships between the volume (v) and pressure (p) of an ideal gas at constant temperature?
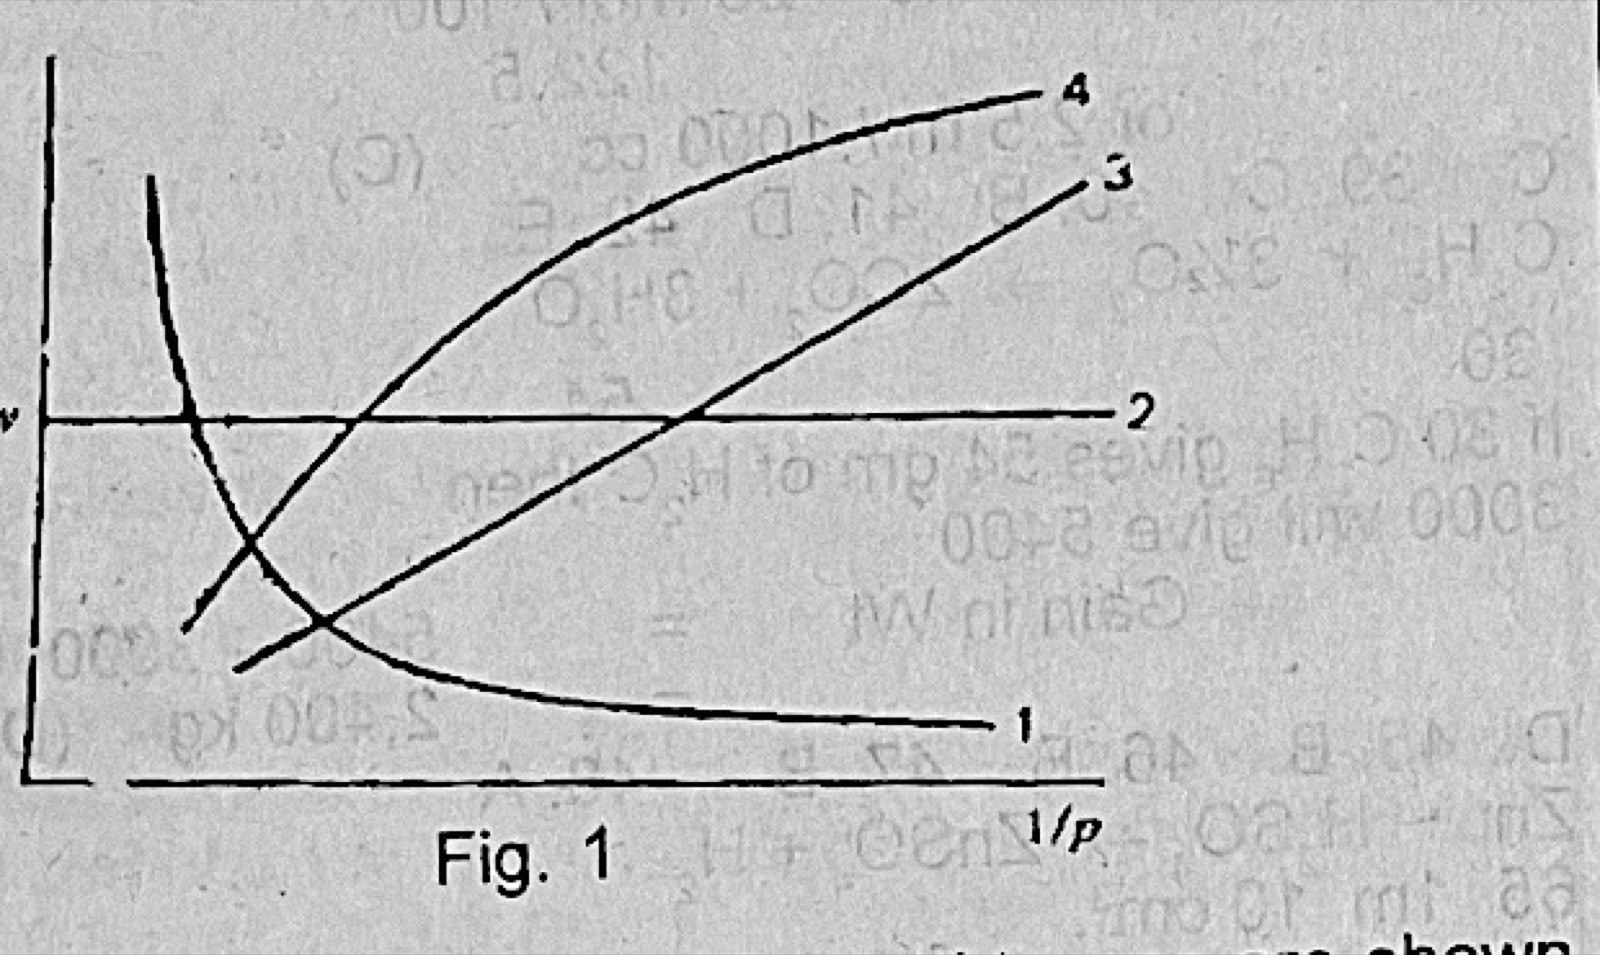
- A.1
- B.2
- C.3
- D.4
- E.1 and 3
Show the answer and explanation
Answer: C (3)
Explanation
Boyle's law says V = k/p at constant temperature, so a graph of V against 1/p is a straight line rising steadily. Curve 3 is that straight line.