Question 38
VariationUse the graph of frequency against height of cassava in metres to answer: The graph illustrates
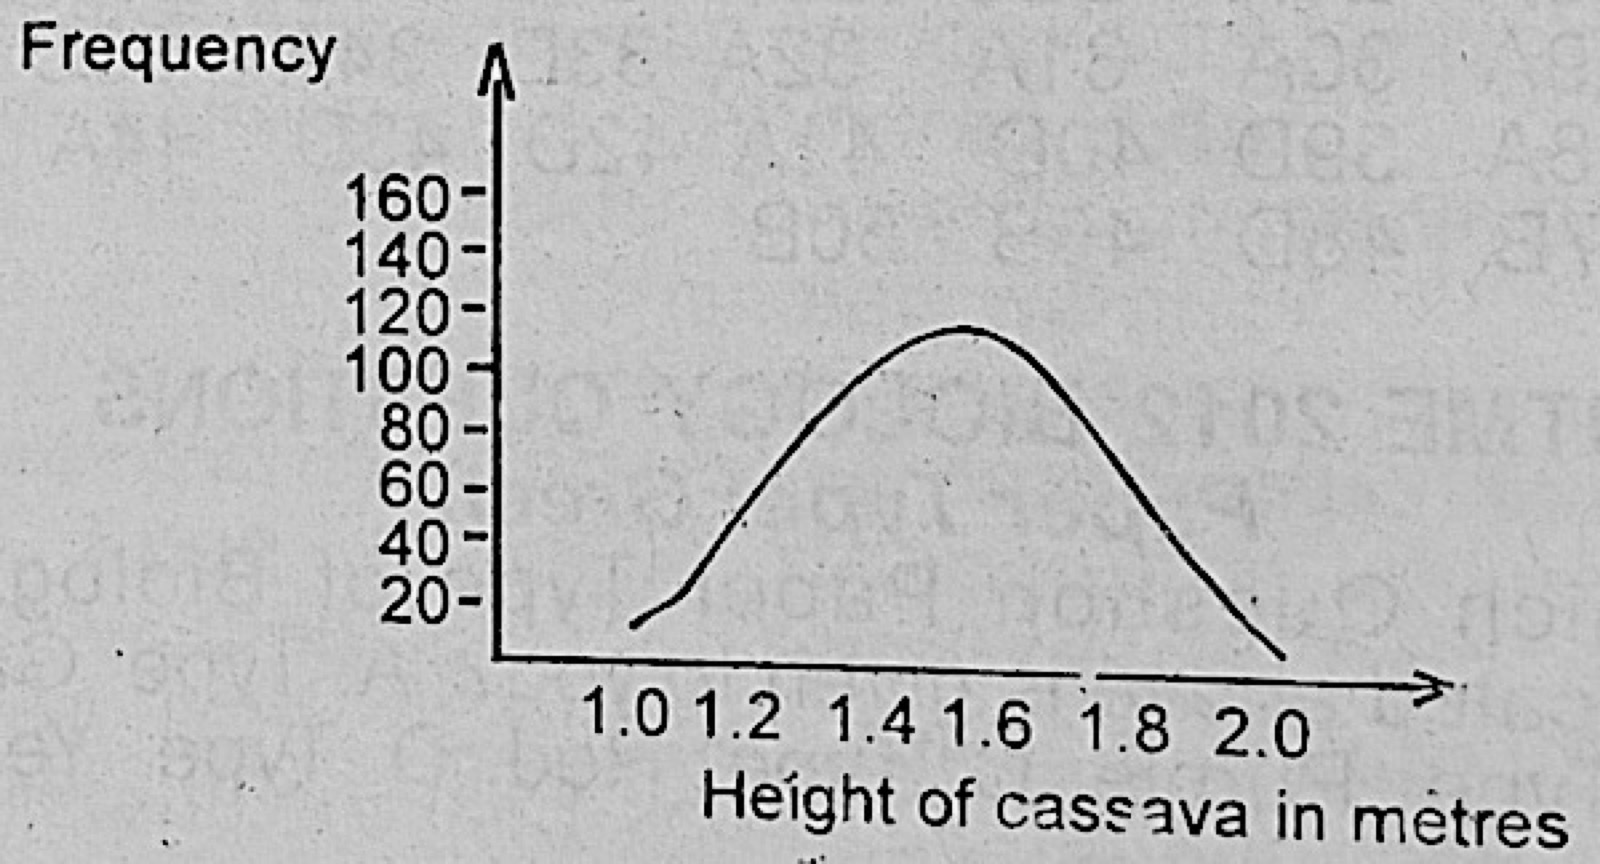
- A.the highest frequency for height of 2 metres
- B.a discontinuously varying character
- C.a continuously varying character
- D.total yield in a cassava farm.
Show the answer and explanation
Answer: C (a continuously varying character)
Explanation
Height takes a full range of values and gives a smooth bell-shaped curve, which is typical of continuous variation.