Question 34
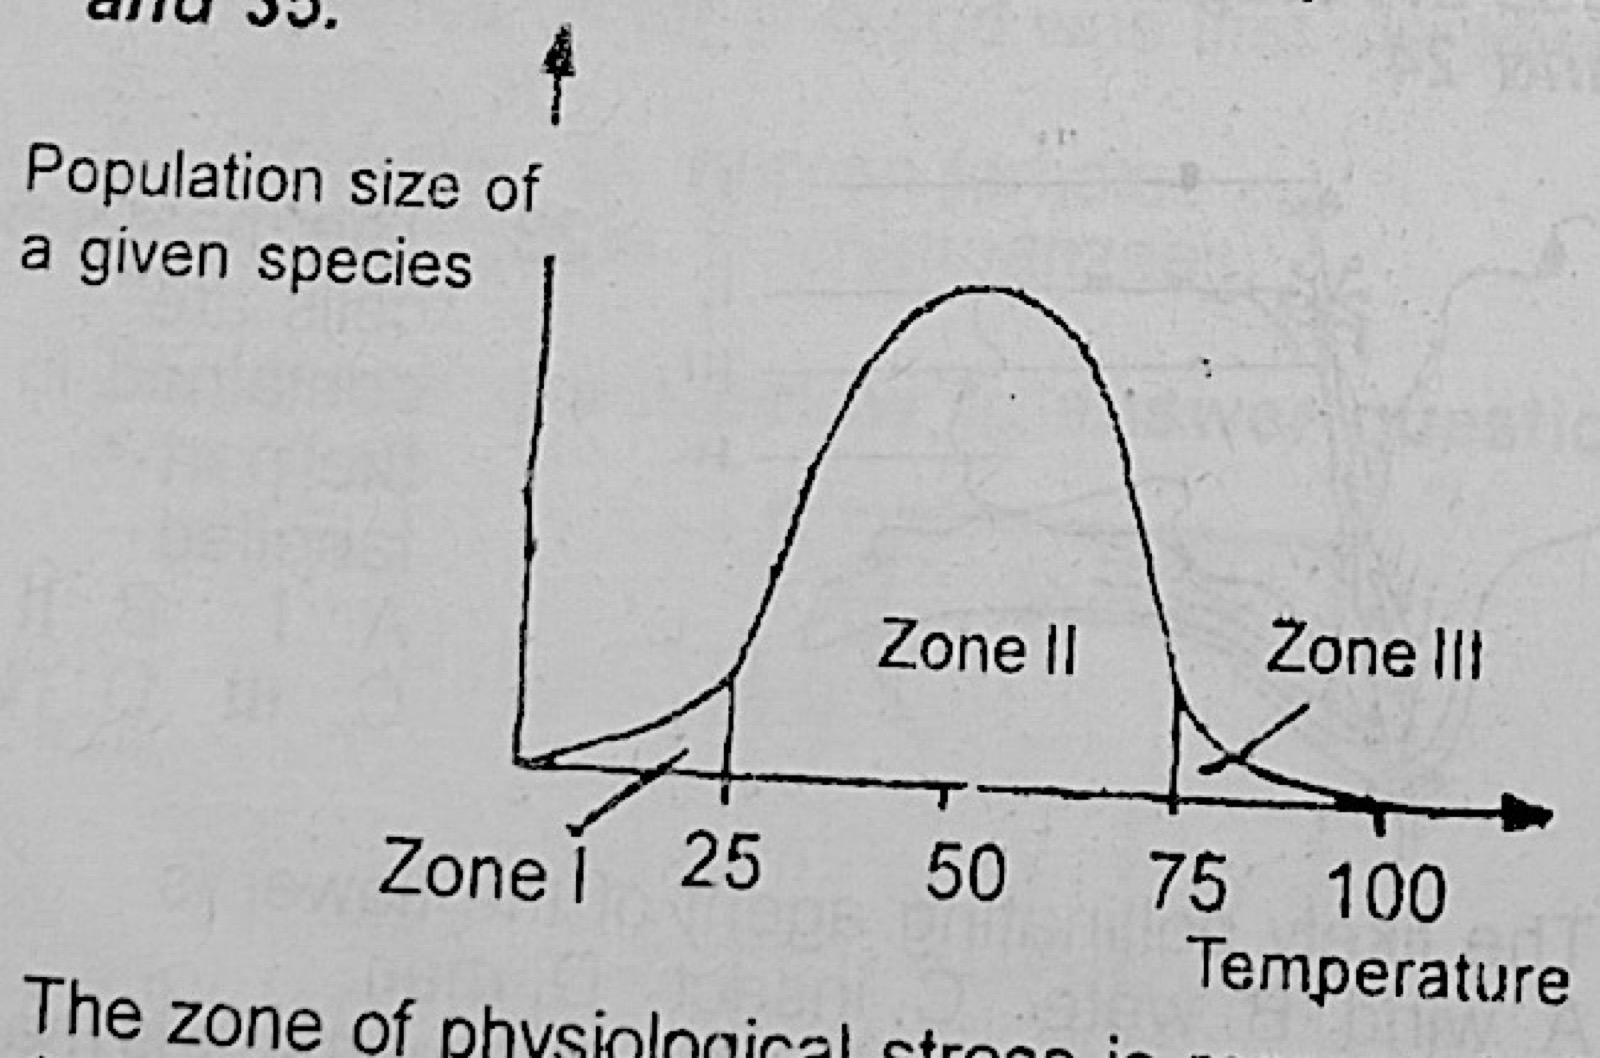
Ecosystem and Ecological FactorsUse the graph to answer: The zone of physiological stress is represented by
- A.I and II
- B.II only
- C.II and III
- D.I and III.
Show the answer and explanation
Answer: D (I and III.)
Explanation
In zones I and III the temperature is too low or too high, so only a few individuals survive. These are the stress zones; zone II is the optimum range.