Question 26
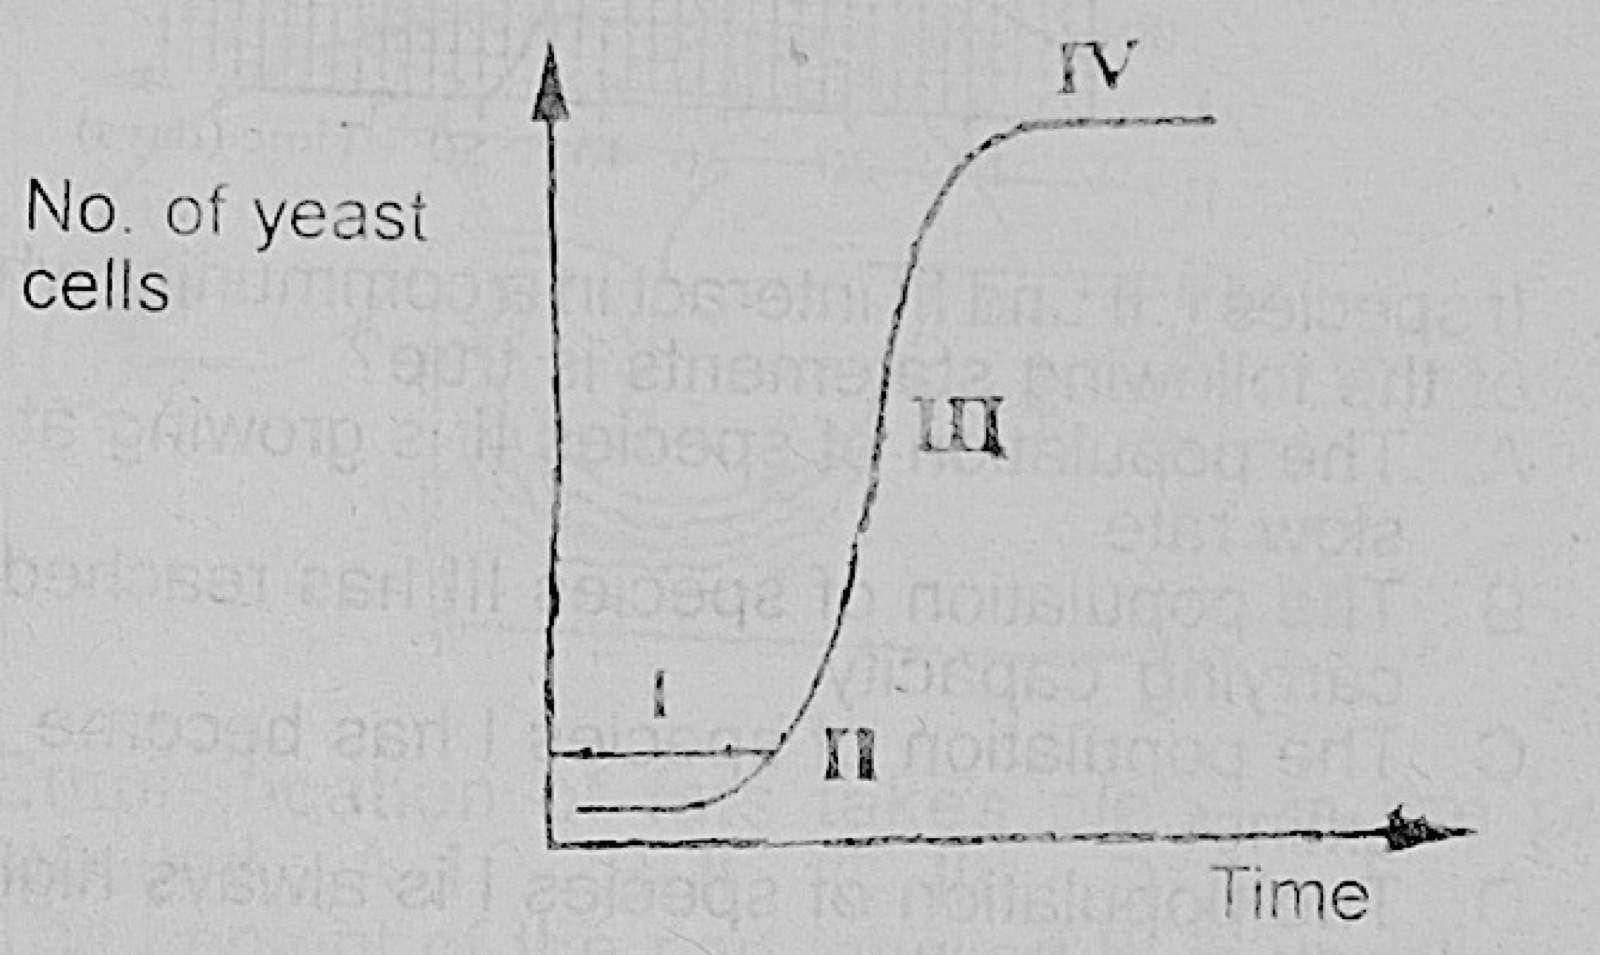
Population EcologyUse the diagram to answer: The part labelled I represents the
- A.stationary phase
- B.lag phase
- C.log phase
- D.steady phase.
Show the answer and explanation
Answer: B (lag phase)
Explanation
At the start of the curve the yeast numbers hardly rise while the cells adjust to the new medium. This slow start is the lag phase.