Question 43
Population EcologyUse the graph (number of organisms against time for communities I and II): The above diagram represents a competitive interaction between organisms in communities I and II. Which of the following statements is CORRECT?
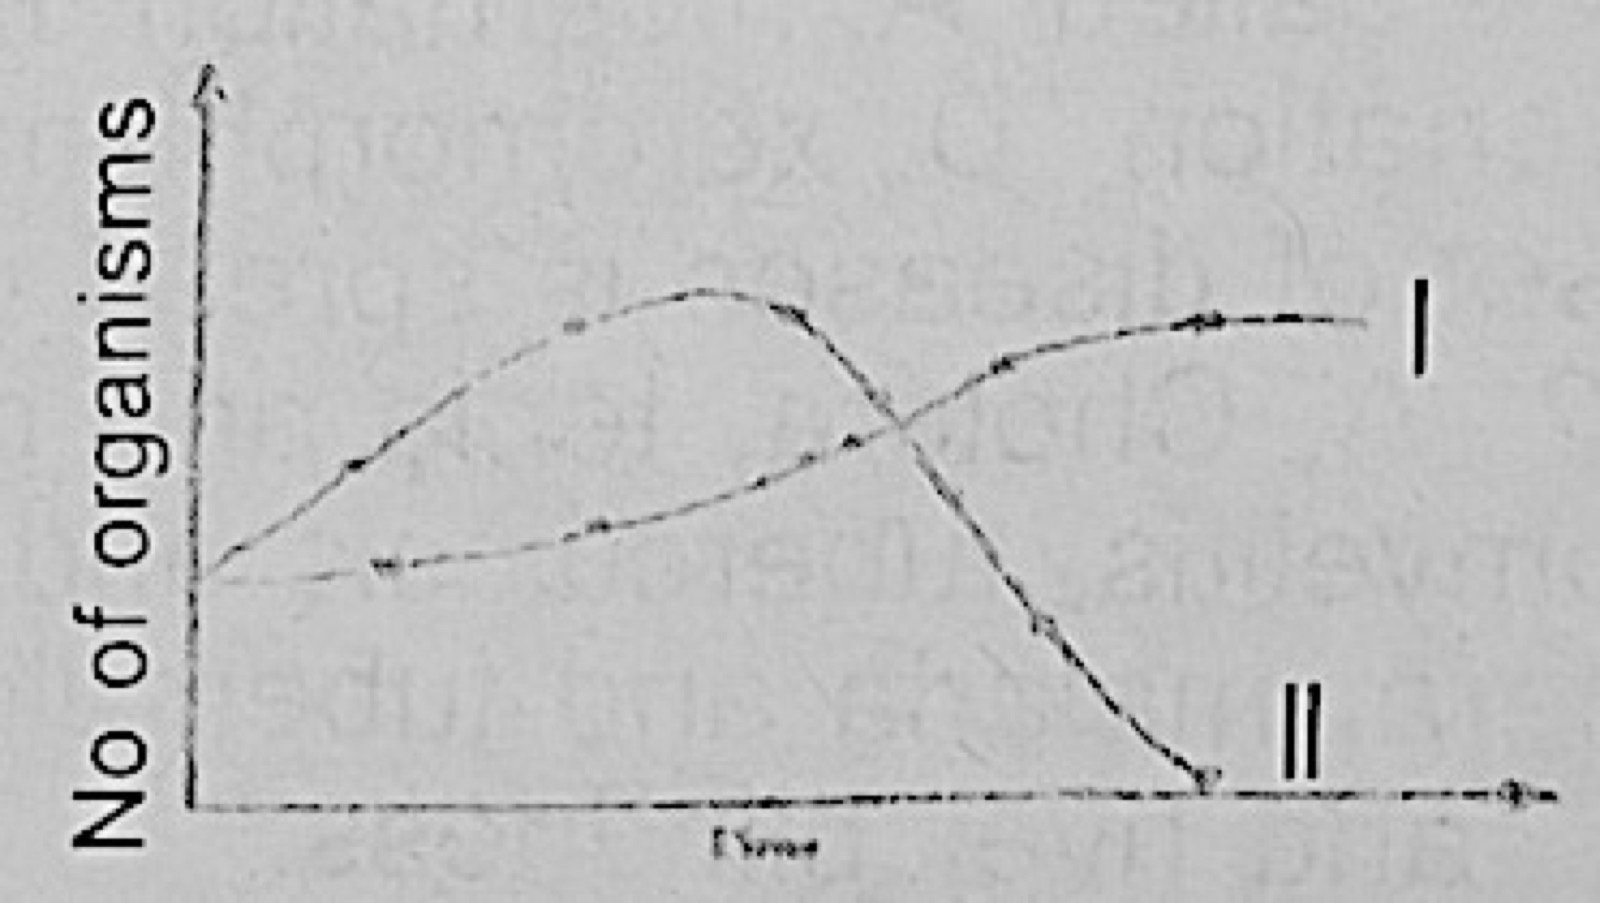
- A.The population of I was higher than II at the beginning of the experiment
- B.II was wiped out from the environment at the end of the experiment
- C.The population of II was always lower than that of I
- D.The population of I was lower at the end of the experiment than at the beginning
Show the answer and explanation
Answer: B (II was wiped out from the environment at the end of the experiment)
Explanation
Curve II rises, then falls to zero at the end, so II was eliminated by the competition; I rose and levelled off.