Question 8
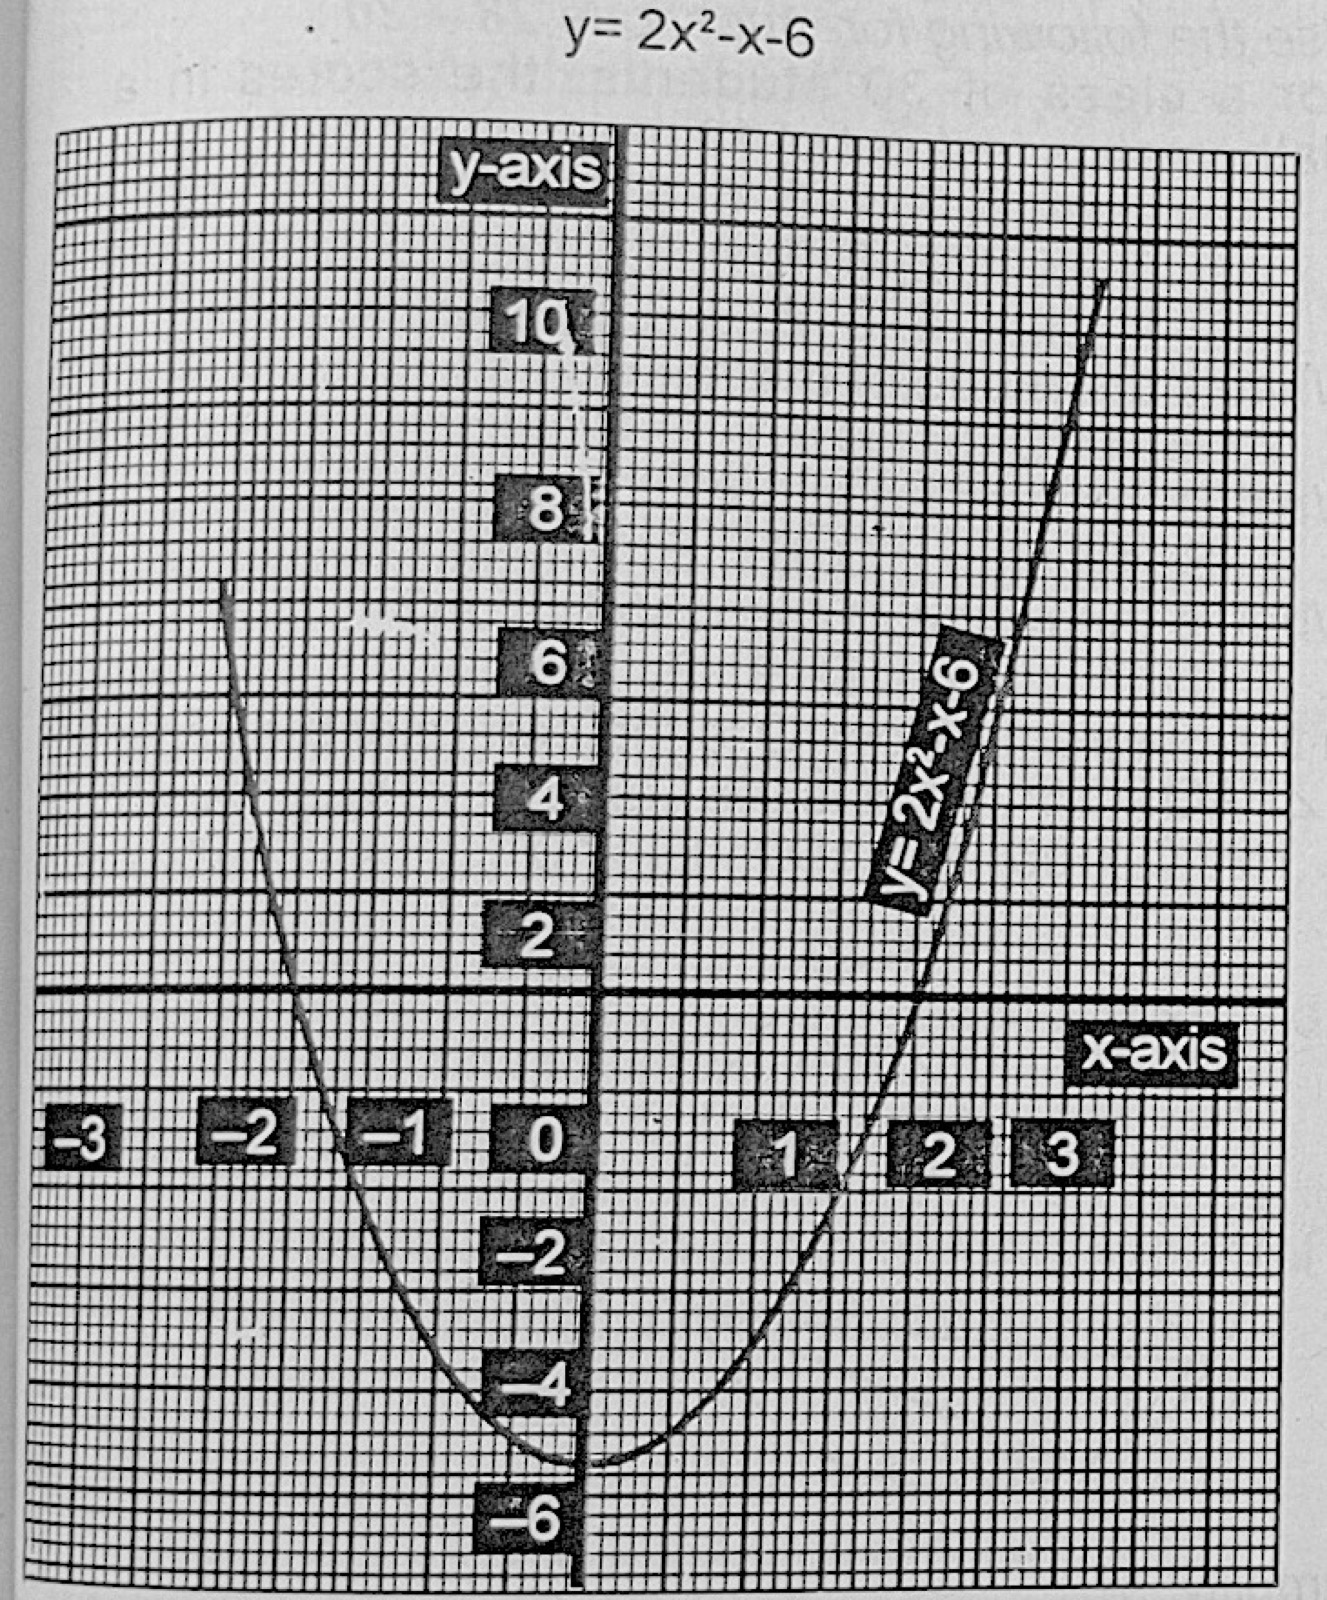
Graphs of FunctionsThe graph below is that of a quadratic function y = 2x2 − x − 6. Use the information provided by the graph. Find the minimum value of y.
- A.y = 2
- B.y = 0
- C.y = 1.5
- D.y = −6
- E.y = −8
Show the answer and explanation
Answer: D (y = −6)
Explanation
The lowest point of the curve is at about y = −6 (exactly −6.125 at x = ¼), so the nearest option is y = −6.