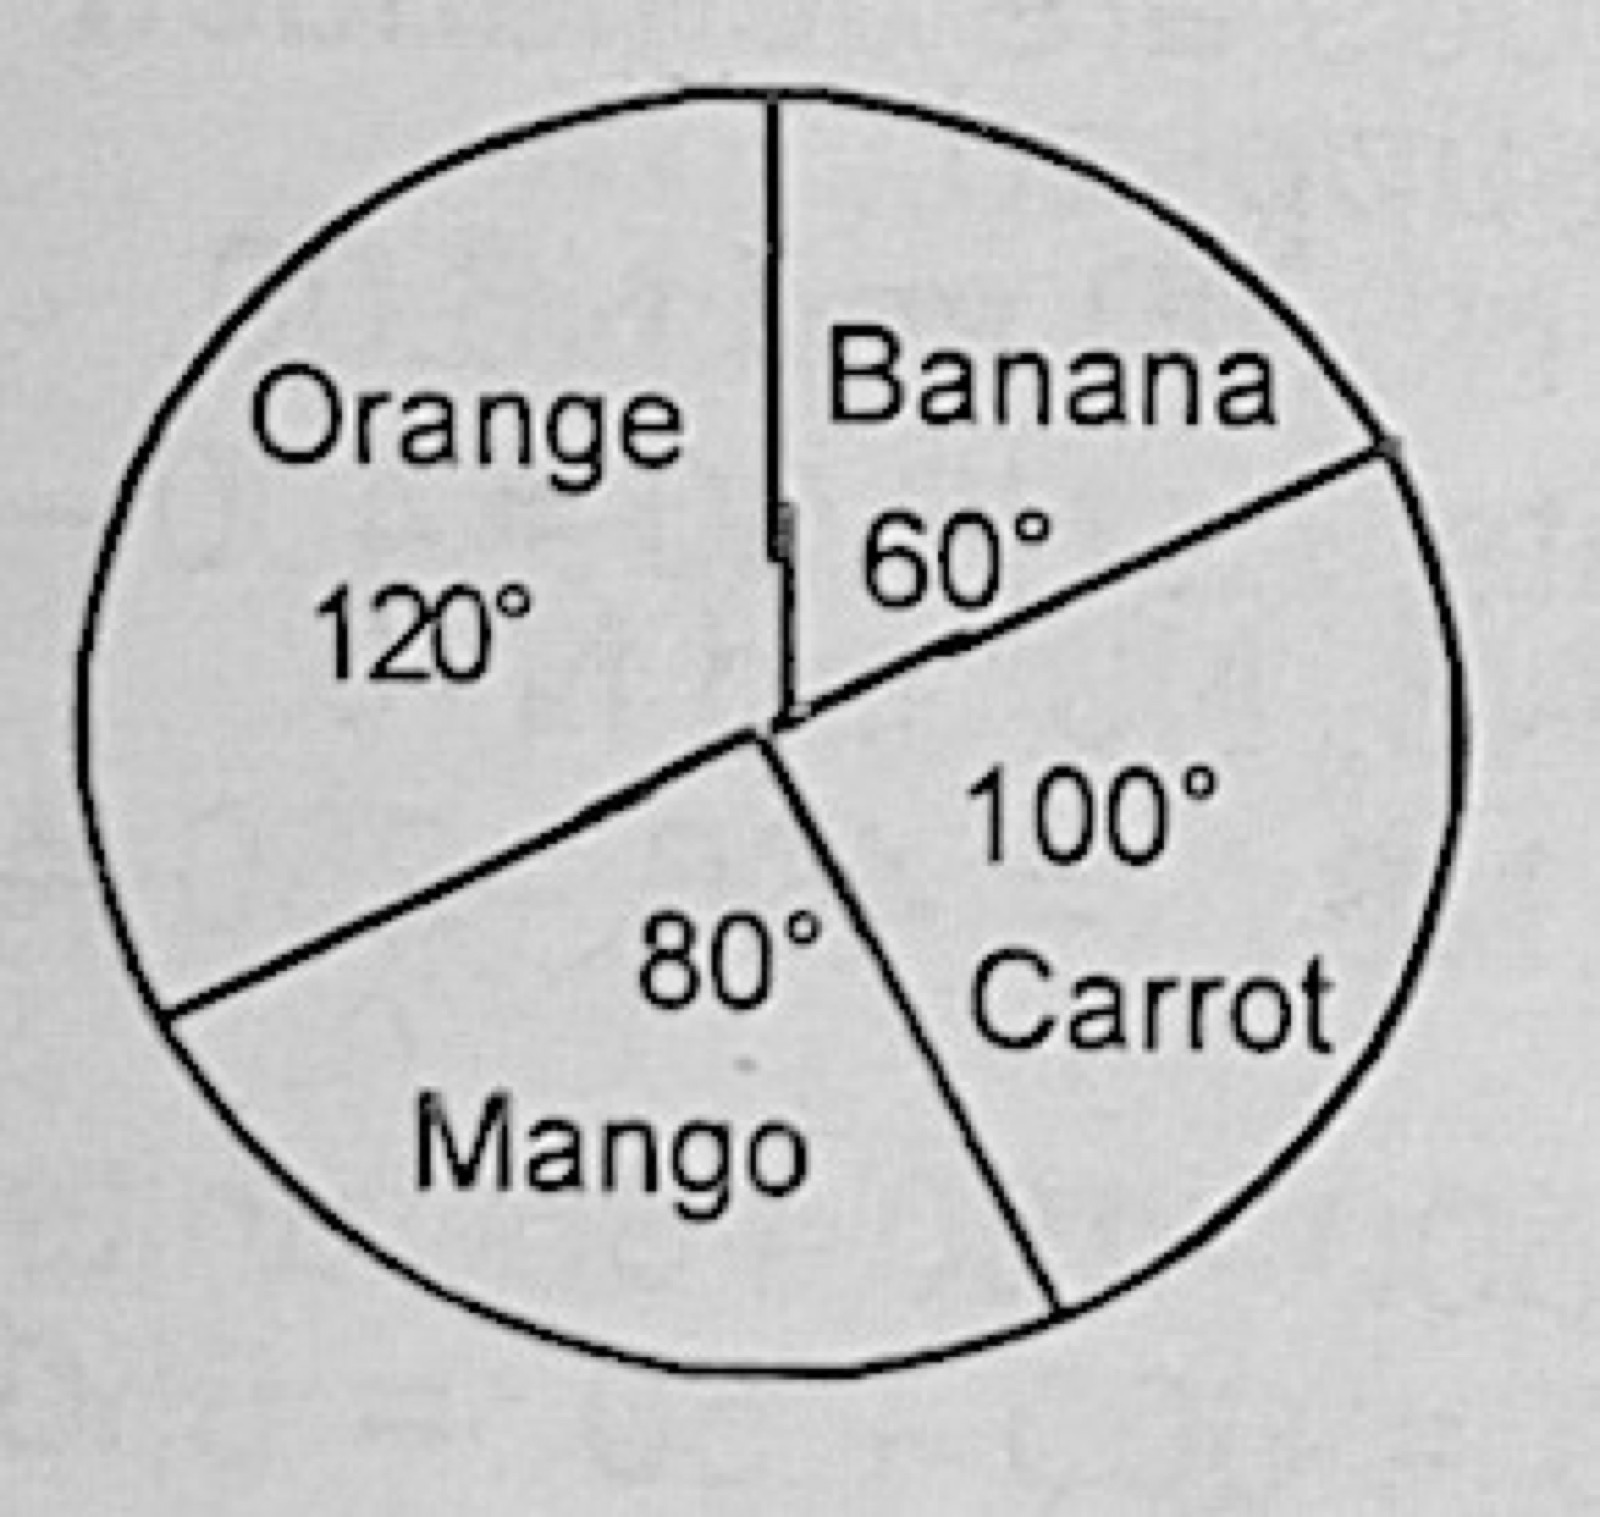
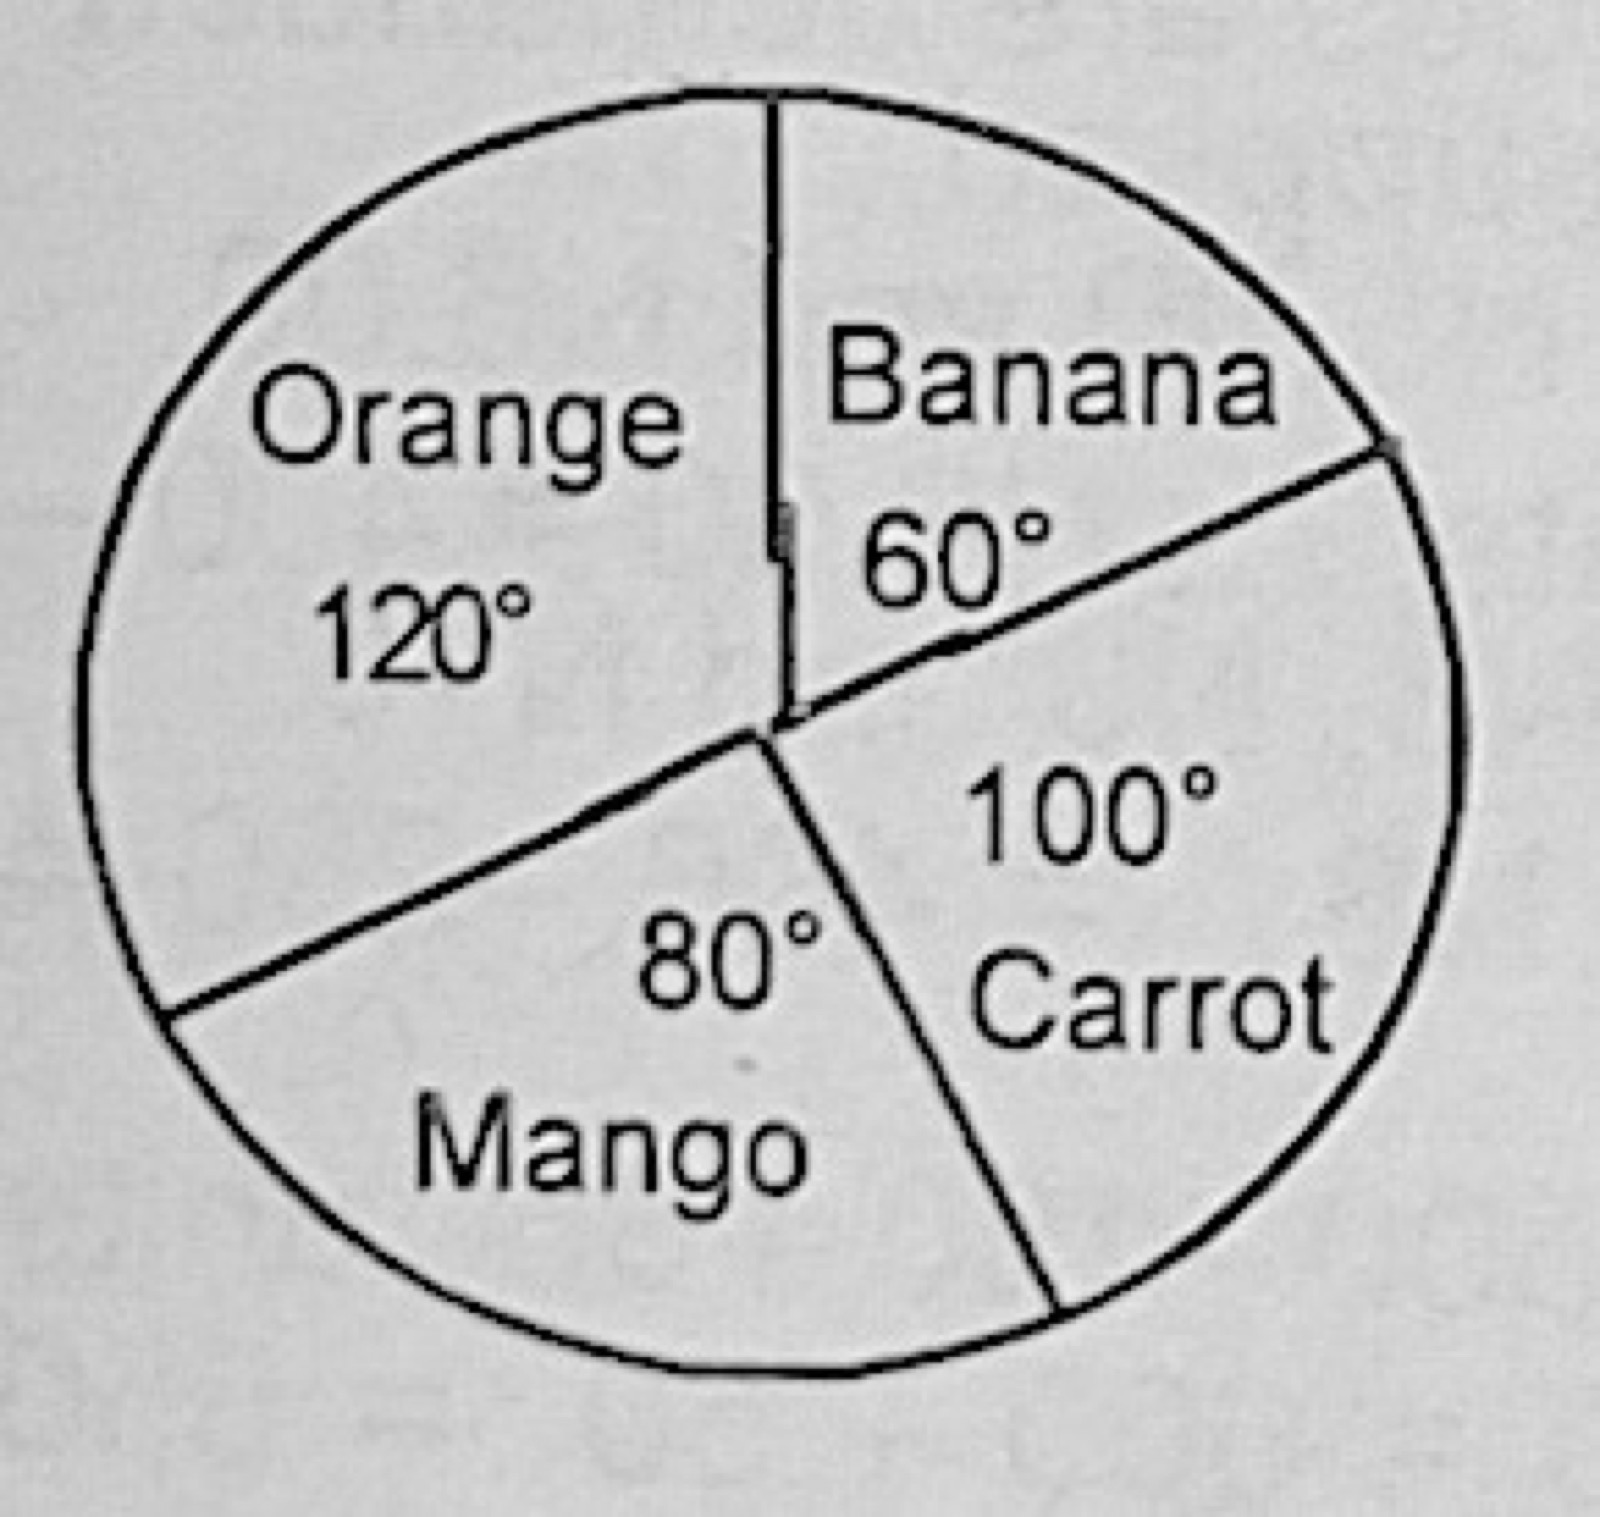
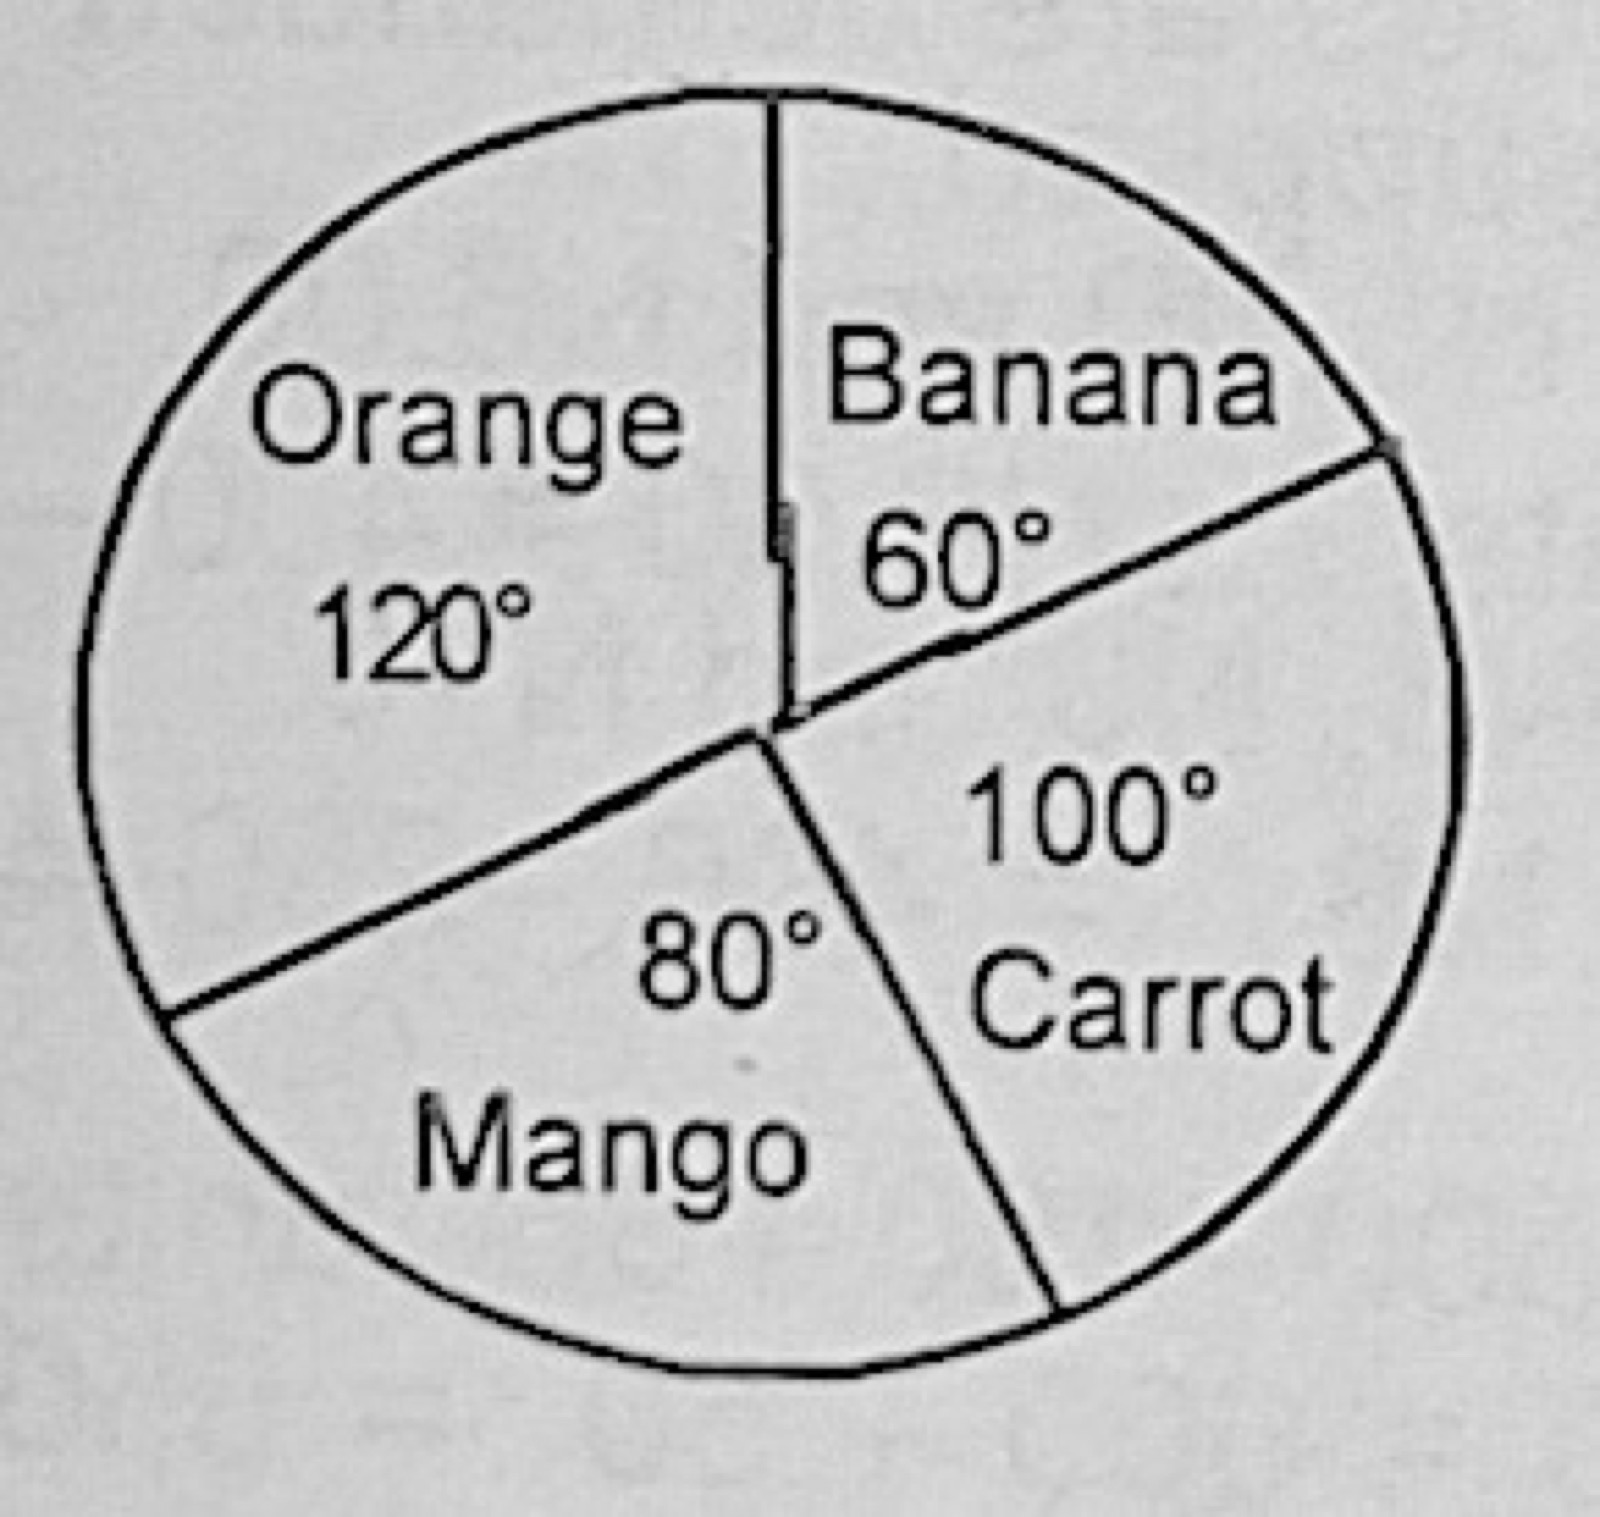
Use the diagram below to answer questions 3 to 5. The total number of fruits consumed by a family in a year is 720, and this is represented by the pie chart below. The quantity of banana consumed by the family is
Use the diagram below to answer questions 3 to 5. The total number of fruits consumed by a family in a year is 720, and this is represented by the pie chart below. The sum total of the quantity of mango and orange consumed by the family is
Use the diagram below to answer questions 3 to 5. The total number of fruits consumed by a family in a year is 720, and this is represented by the pie chart below. The quantity of carrot consumed by the family is
Section A: answer one question only from this section. Utility Schedule Quantity of goods consumed: 0, 1, 2, 3, 4, 5, 6 Total utility: 0, 10, 16, ?, ?, 23, 23 Marginal utility: 0, 10, ?, 4, ?, 1, ? (a) Complete the above utility schedule (b) Draw the marginal utility curve (c) (i) At what quantity does TU equal MU? (ii) What is the value of MU when TU reaches the maximum? (iii) What happens to the values of TU as the quantity consumed increases? (iv) What happens to the values of MU as the quantity consumed increases?
Show the model answer
Model answer
(a) MU = change in TU MU at 2 units = 16 − 10 = 6 TU at 3 units = 16 + 4 = 20 TU at 4 units = 23 − 1 = 22, so MU at 4 units = 22 − 20 = 2 MU at 6 units = 23 − 23 = 0 (b) Quantity on the horizontal axis, MU on the vertical axis: MU falls from 10 to 6, 4, 2, 1 and reaches 0 at 6 units (a downward-sloping curve) (c)(i) TU equals MU at 1 unit (10 = 10) (also at 0 units) (ii) MU is zero when TU is at its maximum (iii) TU increases at a decreasing rate, reaches a maximum (23) and then stays constant (iv) MU diminishes as more is consumed (law of diminishing marginal utility)
Explanation
Fill the gaps using MU = change in TU, working forwards and backwards.
Section A: answer one question only from this section. The daily sales of department store for one week are as follows Days: Mon, Tue., Wed., Thu., Fri., Sat. Sales N: 1,750, 1,000, 3,500, 2,250, 1,000, 2,500 (a) Present the above data in a bar graph. (The use of graph sheet is essential) (b) Calculate the average daily sales for the week.
Show the model answer
Model answer
(a) Title the graph; days on the horizontal axis, sales (N) on the vertical axis with a suitable scale (e.g. 1 cm = N500) Six bars of equal width, equally spaced, with heights N1,750, N1,000, N3,500, N2,250, N1,000 and N2,500 Label both axes (b) Total sales = 1,750 + 1,000 + 3,500 + 2,250 + 1,000 + 2,500 = N12,000 Average daily sales = N12,000 ÷ 6 = N2,000
Explanation
Bars must be equal in width with gaps between them; heights follow the scale.
Section B: answer three questions only from this section. In what ways can the government improve agricultural production in Nigeria?
Show the model answer
Model answer
Give credit and loans to farmers at low interest (e.g. through agricultural banks) Subsidise inputs such as fertilisers, improved seeds, chemicals and tractors Improve extension services to teach farmers modern methods Fund agricultural research institutes to develop high-yielding varieties Provide rural infrastructure: feeder roads, storage, water, electricity Guarantee prices / stabilise prices of farm produce Provide irrigation and dams Reform land tenure to allow large-scale farming Encourage mechanisation and agro-based industries Provide social amenities in rural areas to reduce rural–urban drift
Explanation
Give at least six measures, each with a brief explanation.
Section B: answer three questions only from this section. Define ageing population and explain its effects on an economy.
Show the model answer
Model answer
An ageing population is one in which the proportion of old people (usually 60/65 years and above) is increasing Effects: high dependency ratio, as a smaller working population supports more old people Government spends more on pensions, health care and old people's homes The labour force becomes less mobile geographically and occupationally Shortage of young workers and less innovation Pattern of consumption shifts towards goods and services for the elderly Lower savings and investment, possibly slower growth Higher taxes on workers to support the elderly
Explanation
Define clearly, then explain at least four effects.
Section B: answer three questions only from this section. Explain any three weapons that can be used by a trade union and any two weapons that can be used by an employer's association during a trade dispute.
Show the model answer
Model answer
Trade union weapons (any three): collective bargaining/negotiation with employers Strike: workers stop work completely Work-to-rule: workers follow rules strictly so output slows Go-slow: deliberately slowing down work Picketing: striking workers stand at the gates to discourage others from working Boycott / sit-in / ultimatum Employers' association weapons (any two): lock-out: closing the factory to workers until the dispute is settled Employing strike breakers (blacklegs) to keep production going Blacklisting / dismissal of union activists Collective bargaining / negotiation Seeking court injunctions
Section B: answer three questions only from this section. Explain five sources of finance that are available to a Public Limited Company.
Show the model answer
Model answer
Sale of shares (ordinary and preference) to the public Debentures: long-term loans from the public at a fixed interest rate Bank loans and overdrafts Ploughed-back (retained) profits Trade credit from suppliers Hire purchase and equipment leasing Bills of exchange Loans from development banks and other financial institutions
Section B: answer three questions only from this section. State any two ways by which monopolistic competition and perfect competition are similar and any three ways in which they are different.
Show the model answer
Model answer
Similarities (any two): both have a large number of firms Free entry into and exit from the industry Both maximise profit where MC = MR Both can make supernormal profit in the short run but only normal profit in the long run Differences (any three): products are homogeneous in perfect competition but differentiated in monopolistic competition A perfect competitor is a price taker; a monopolistic competitor has some control over price The demand curve is horizontal (perfectly elastic) in perfect competition but downward sloping in monopolistic competition In equilibrium P = MR = MC in perfect competition; in monopolistic competition P is greater than MR and MC Advertising is used in monopolistic competition but not needed in perfect competition Monopolistic competition has excess capacity in the long run; perfect competition produces at minimum AC
Section B: answer three questions only from this section. (a) Explain the methods of measuring the national income of a country (b) State any three problems associated with measuring national income.
Show the model answer
Model answer
(a) Output (product) method: add the value of final goods and services produced by all sectors in a year, or the value added at each stage, to avoid double counting Income method: add the incomes of all factors of production (wages, rent, interest, profits); exclude transfer payments Expenditure method: add total spending on final goods and services: consumption + investment + government spending + (exports − imports) (b) Any three: double counting Inadequate/unreliable statistics and illiteracy Large subsistence sector not recorded Price changes (inflation) Valuing depreciation and stocks Treatment of transfer payments and unpaid services Net income from abroad hard to estimate
Explanation
Explain all three methods and how each avoids double counting.
Section B: answer three questions only from this section. (a) What is meant by devaluation? (b) Explain the measures by which a country can correct its balance of payments deficit.
Show the model answer
Model answer
(a) Devaluation is the deliberate official reduction of the value of a country's currency in terms of other currencies (b) Devaluation: makes exports cheaper and imports dearer Import restrictions: tariffs, quotas and outright bans Exchange control: rationing foreign exchange Export promotion: incentives, subsidies, diversification of exports Deflationary monetary and fiscal policies to reduce demand for imports Borrowing from the IMF or other countries Attracting foreign investment and loans Using foreign reserves Import substitution industrialisation
Explanation
Define devaluation, then explain at least five measures.
Section B: answer three questions only from this section. (a) Explain the term economic planning (b) Outline the problems of development plans in Nigeria.
Show the model answer
Model answer
(a) Economic planning is a deliberate effort by government to allocate resources to chosen sectors and projects over a stated period in order to achieve set economic goals (growth, employment, etc.) (b) Inadequate and unreliable statistical data Shortage of funds and dependence on oil revenue Shortage of skilled manpower Political instability and frequent changes of government Corruption and mismanagement Over-ambitious targets Poor implementation, monitoring and evaluation Dependence on foreign aid and imported inputs Lack of participation by the people and private sector Inflation raising project costs
Explanation
Define planning, then outline at least five problems.