UI Post-UTME Economics 2016 (Model questions) past questions and answers

3 questions. Try each one, then open the answer to check yourself and read the explanation.

Question 3

Tools of Economic Analysis

Use the pie chart (Mining 126°, Agric 72°, Manufacturing 108°, Services) to answer this question. What is the percentage contribution of services to the national income?
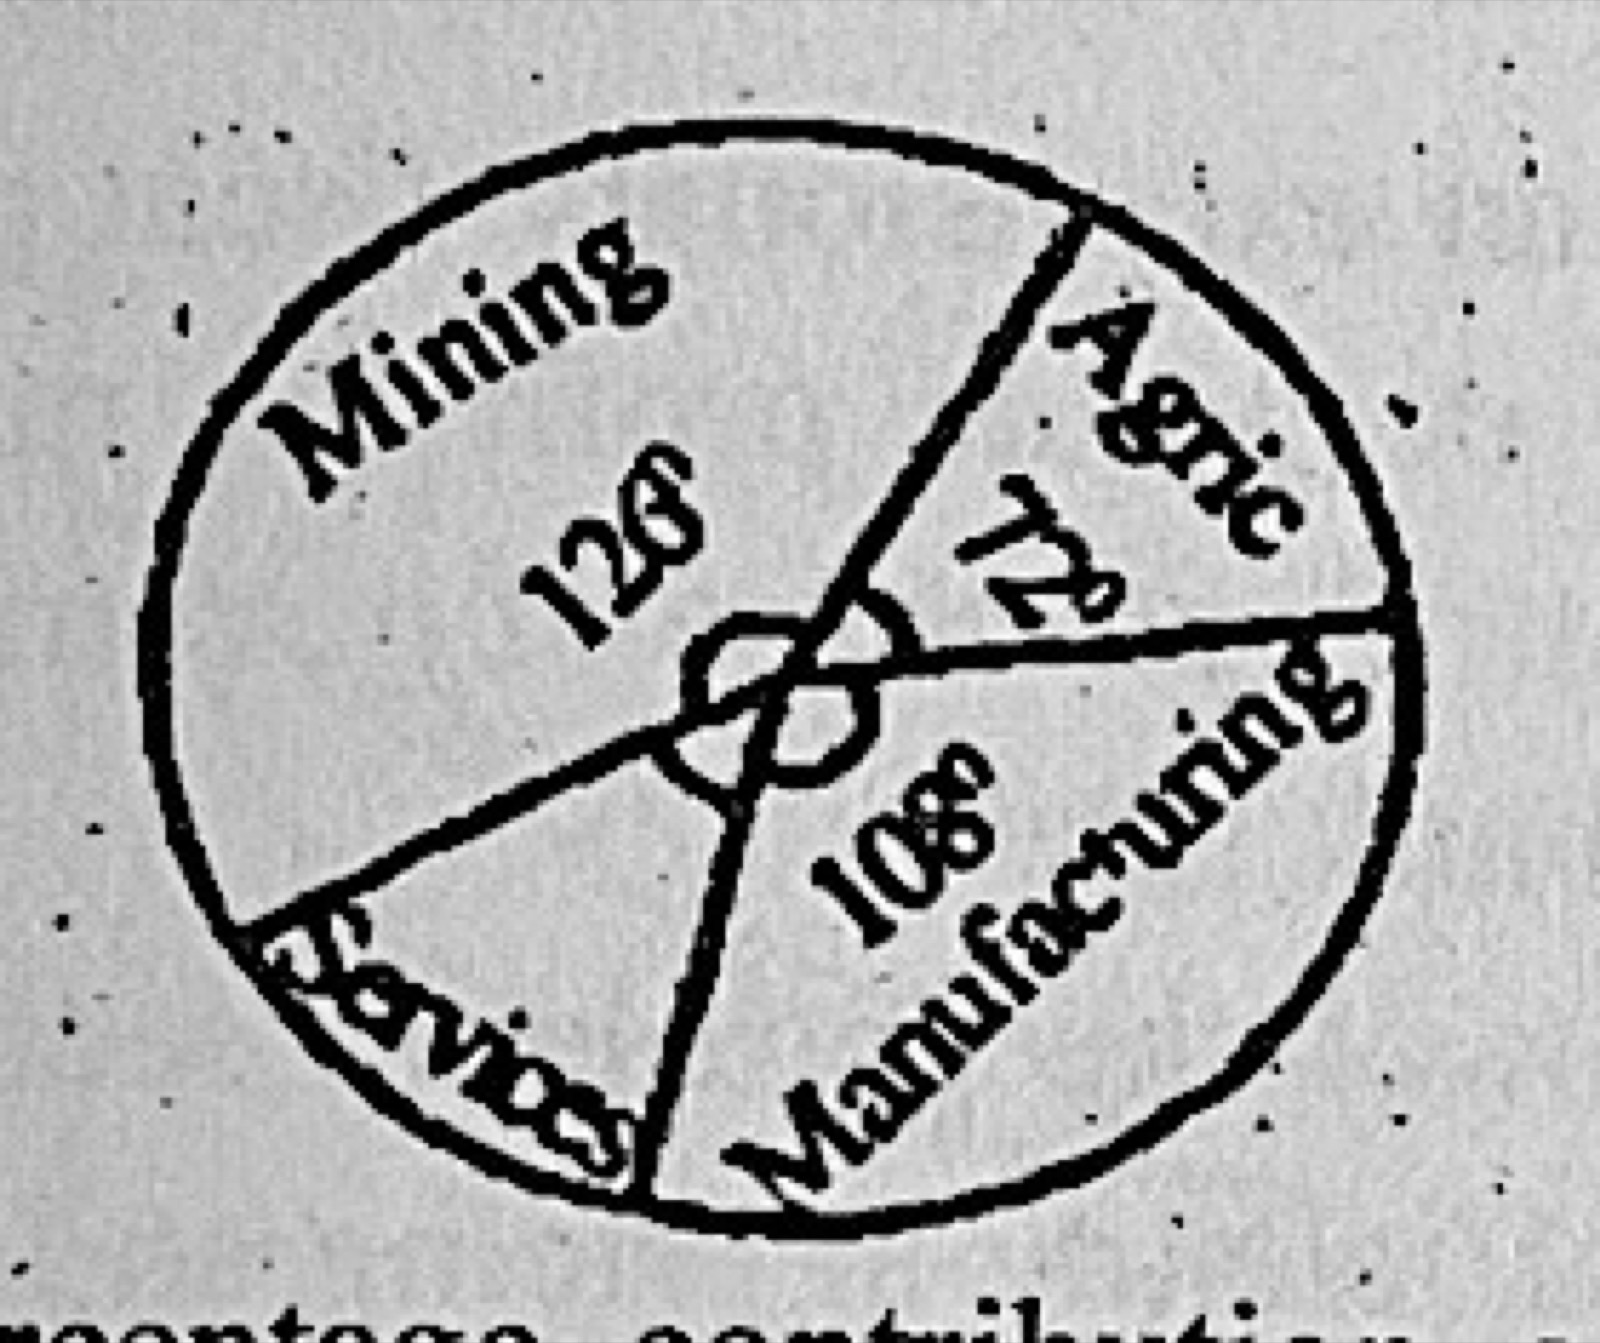
Diagram for this question
  1. A.15%
  2. B.10%
  3. C.54%
  4. D.24%
Show the answer and explanation

Answer: A (15%)

Explanation

Services = 360 − (126 + 72 + 108) = 54°, so its share = 54/360 × 100 = 15%.
Open this question

Question 4

Tools of Economic Analysis

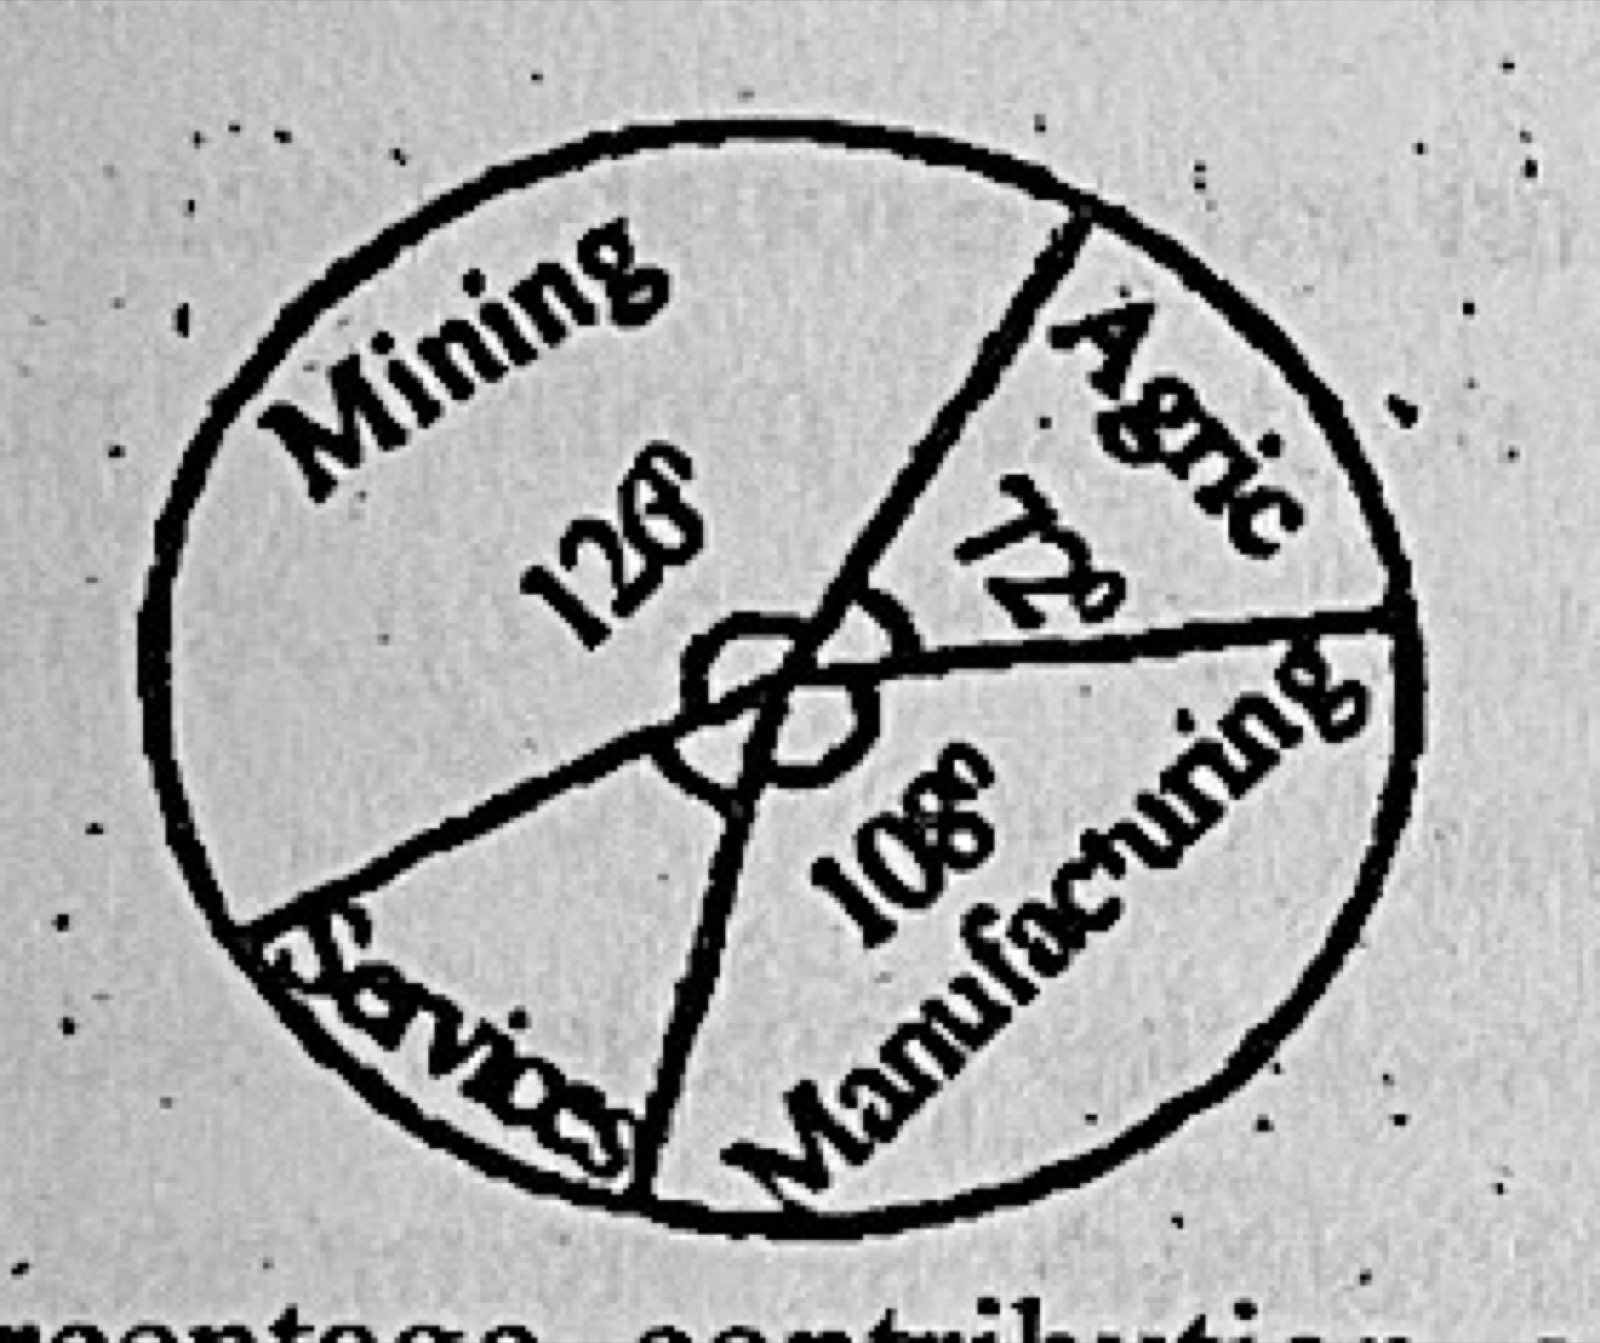
Use the pie chart (Mining 126°, Agric 72°, Manufacturing 108°, Services) to answer this question. If the national income is #60m, the contribution of the manufacturing sector is

Diagram for this question
  1. A.₦12m
  2. B.₦9m
  3. C.₦18m
  4. D.₦17m
Show the answer and explanation

Answer: C (₦18m)

Explanation

Manufacturing = 108/360 × ₦60m = ₦18m.

Open this question

Question 10

Elasticity

Price (₦): 8, 10; Quantity supplied: 20, 24. From the table above, calculate the price elasticity of supply

  1. A.0.50
  2. B.0.80
  3. C.2.00
  4. D.1.25
Show the answer and explanation

Answer: B (0.80)

Explanation

% change in quantity = 4/20 × 100 = 20%; % change in price = 2/8 × 100 = 25%; PES = 20/25 = 0.8.

Open this question