UI Post-UTME Economics 2014 (Model questions) past questions and answers

3 questions. Try each one, then open the answer to check yourself and read the explanation.

Question 12

Tools of Economic Analysis

Use the pie chart (Oil sector 160°, Agriculture sector 90°, Mining sector 30°, Manufacturing sector) to answer this question. The percentage contribution of agriculture is
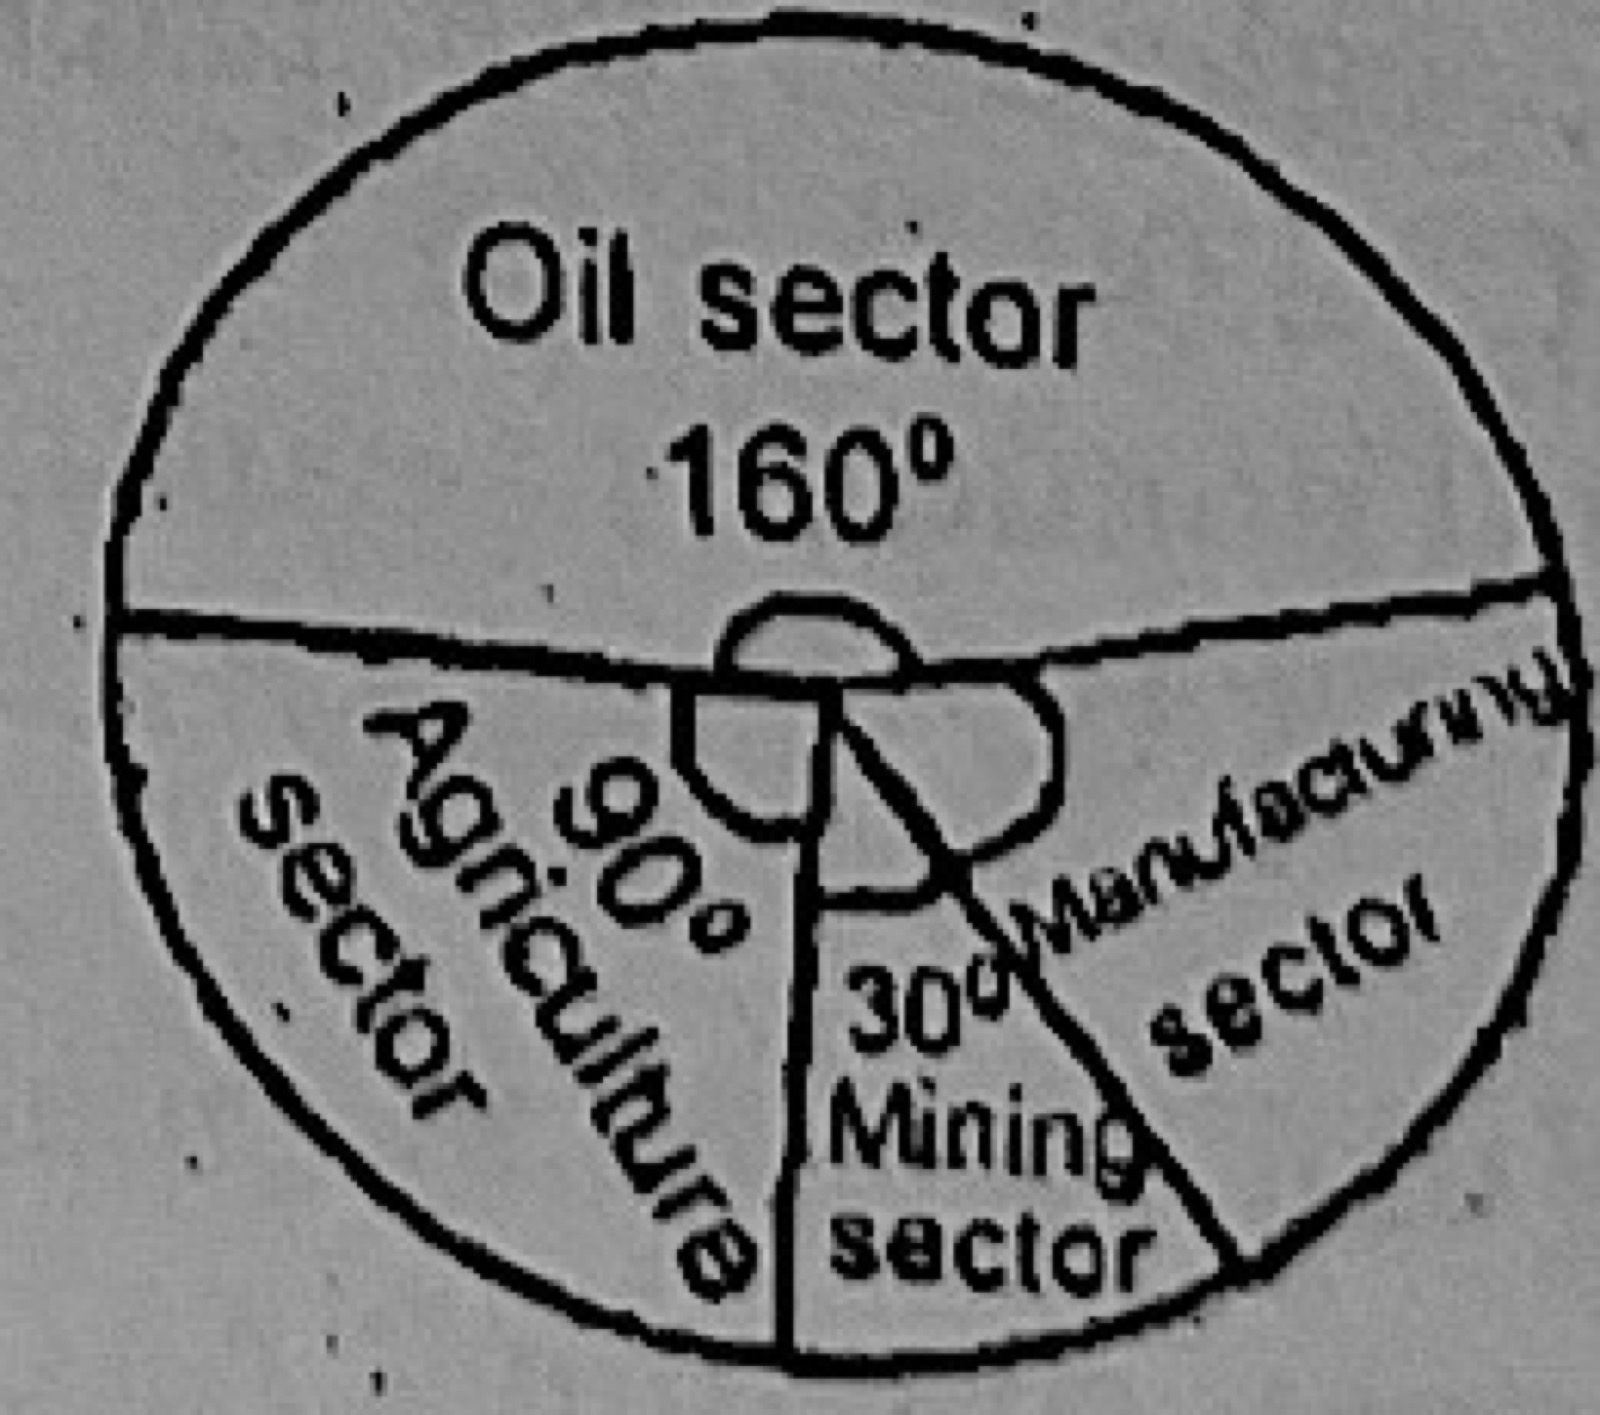
Diagram for this question
  1. A.67.5
  2. B.40.0
  3. C.32.4
  4. D.25.0
Show the answer and explanation

Answer: D (25.0)

Explanation

Agriculture has 90° of 360°, so 90/360 × 100 = 25%.
Open this question

Question 17

Theory of Consumer Behaviour

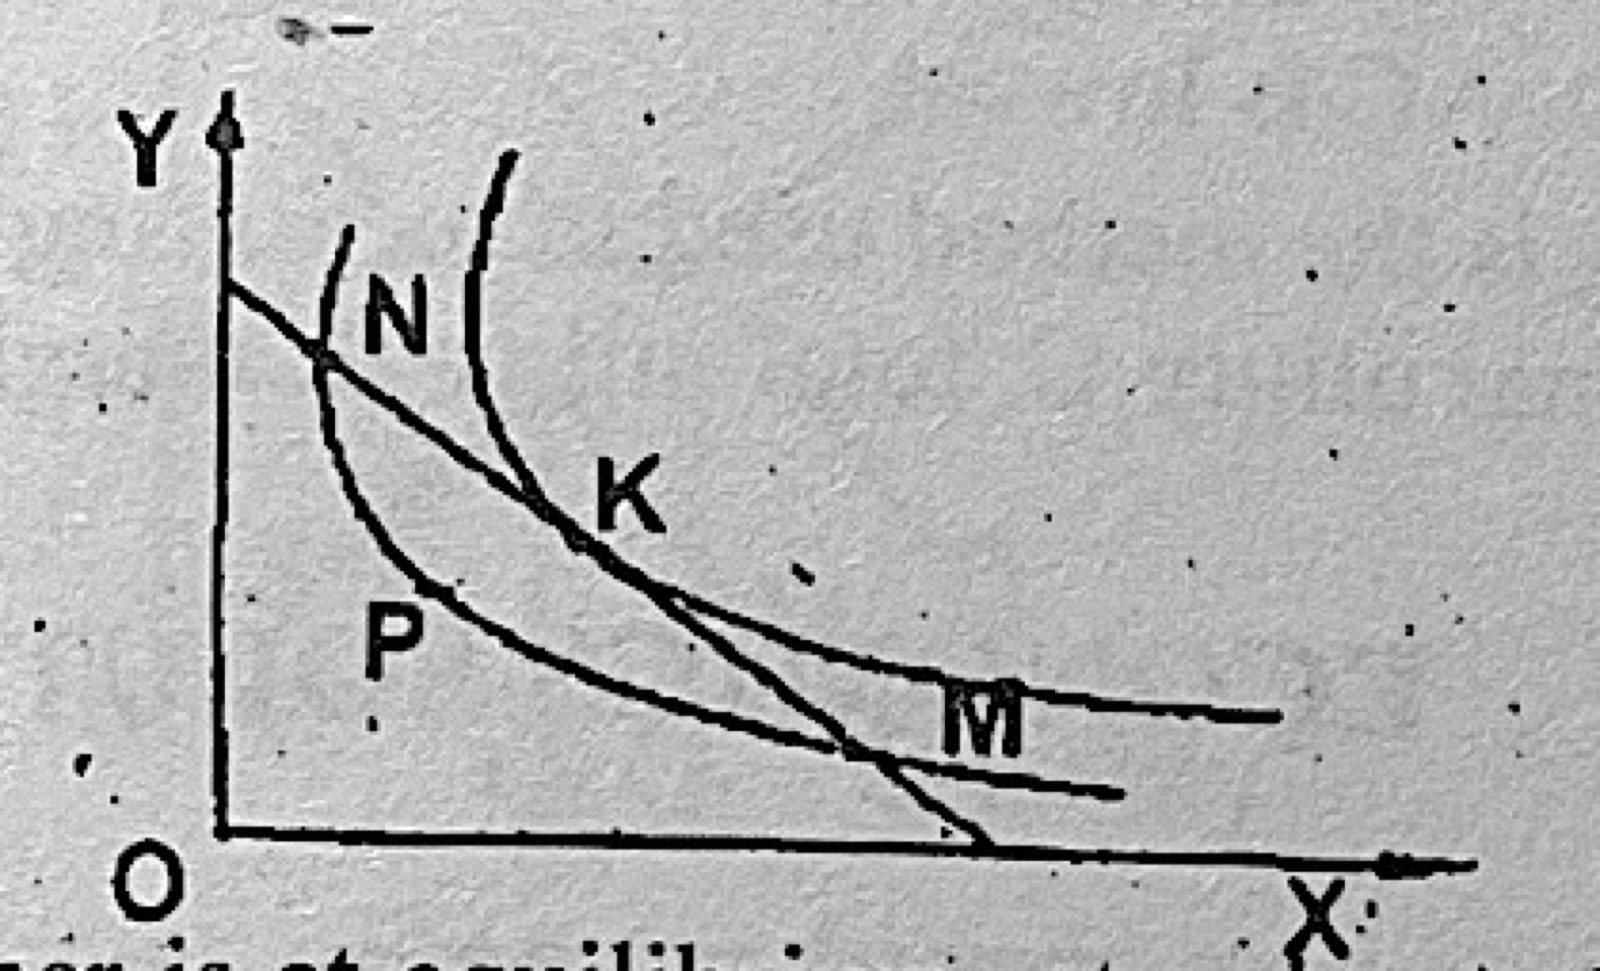
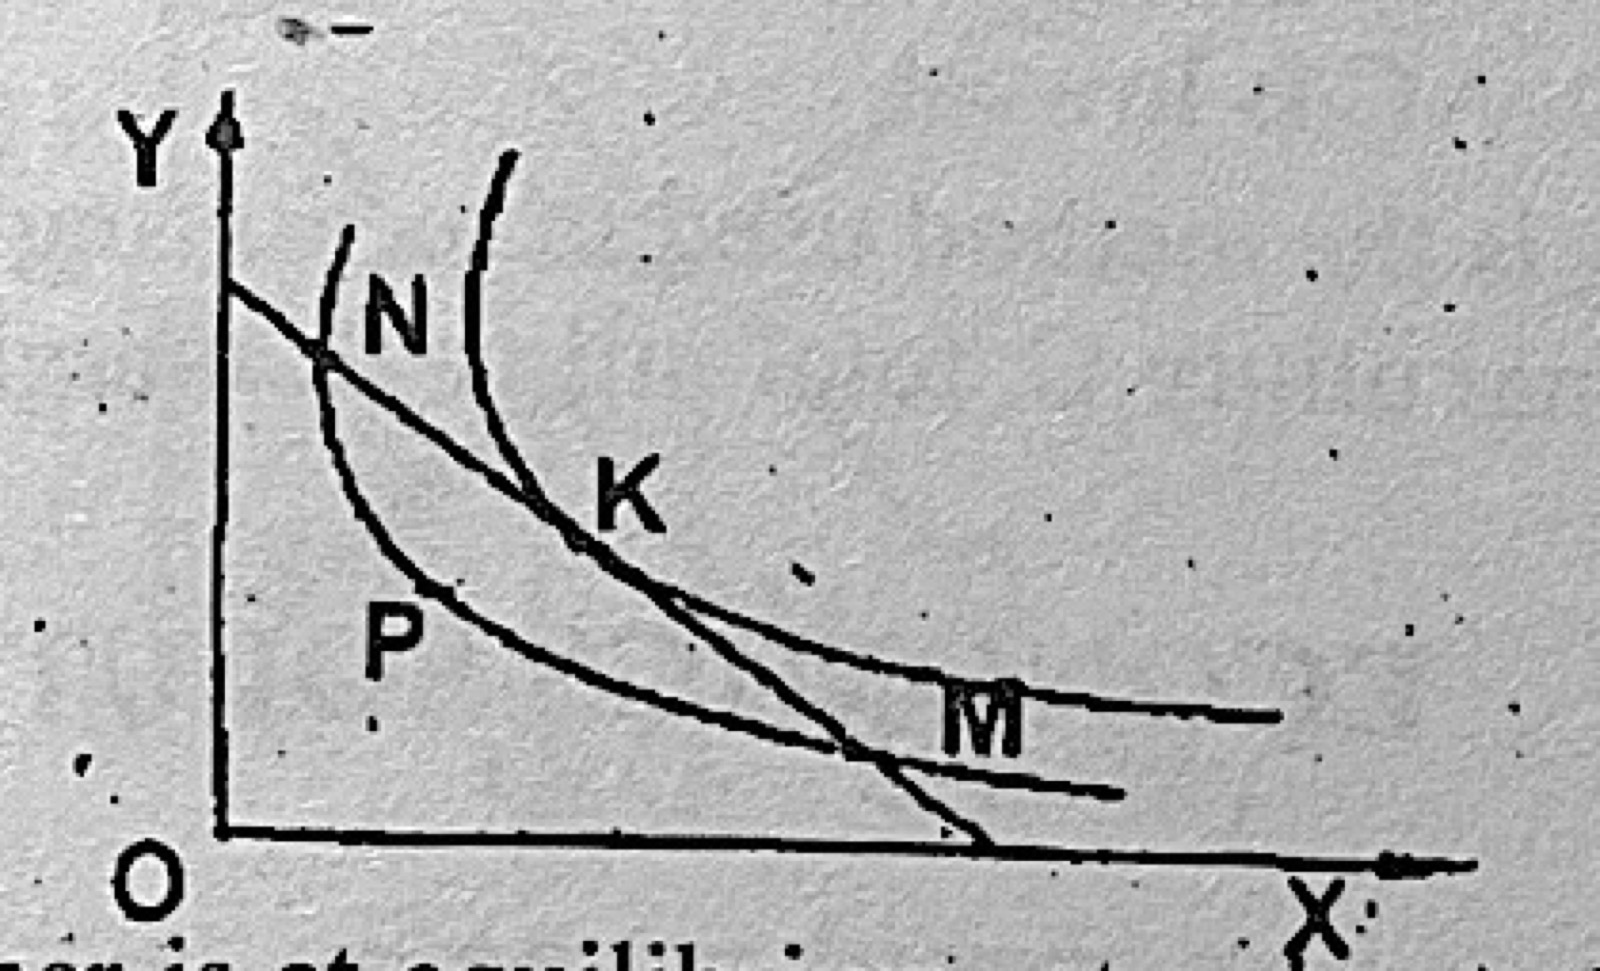
Use the diagram (indifference curves and a budget line, points N, K, P and M) to answer this question. The consumer is at equilibrium, at point

Diagram for this question
  1. A.N
  2. B.P
  3. C.M
  4. D.K
Show the answer and explanation

Answer: D (K)

Explanation

Equilibrium is where the budget line just touches (is tangent to) the highest indifference curve it can reach, which is at K.

Open this question

Question 18

Theory of Consumer Behaviour

Use the diagram (indifference curves and a budget line, points N, K, P and M) to answer this question. To move from point M to K, the consumer has to increase the

Diagram for this question
  1. A.consumption of X and reduce the consumption of Y
  2. B.expenditure on Y
  3. C.expenditure on X
  4. D.consumption of V and reduce the consumption of X.
Show the answer and explanation

Answer: D (consumption of V and reduce the consumption of X.)

Explanation

K lies higher up the budget line than M, so moving there means buying more Y and less X.

Open this question