Question 4
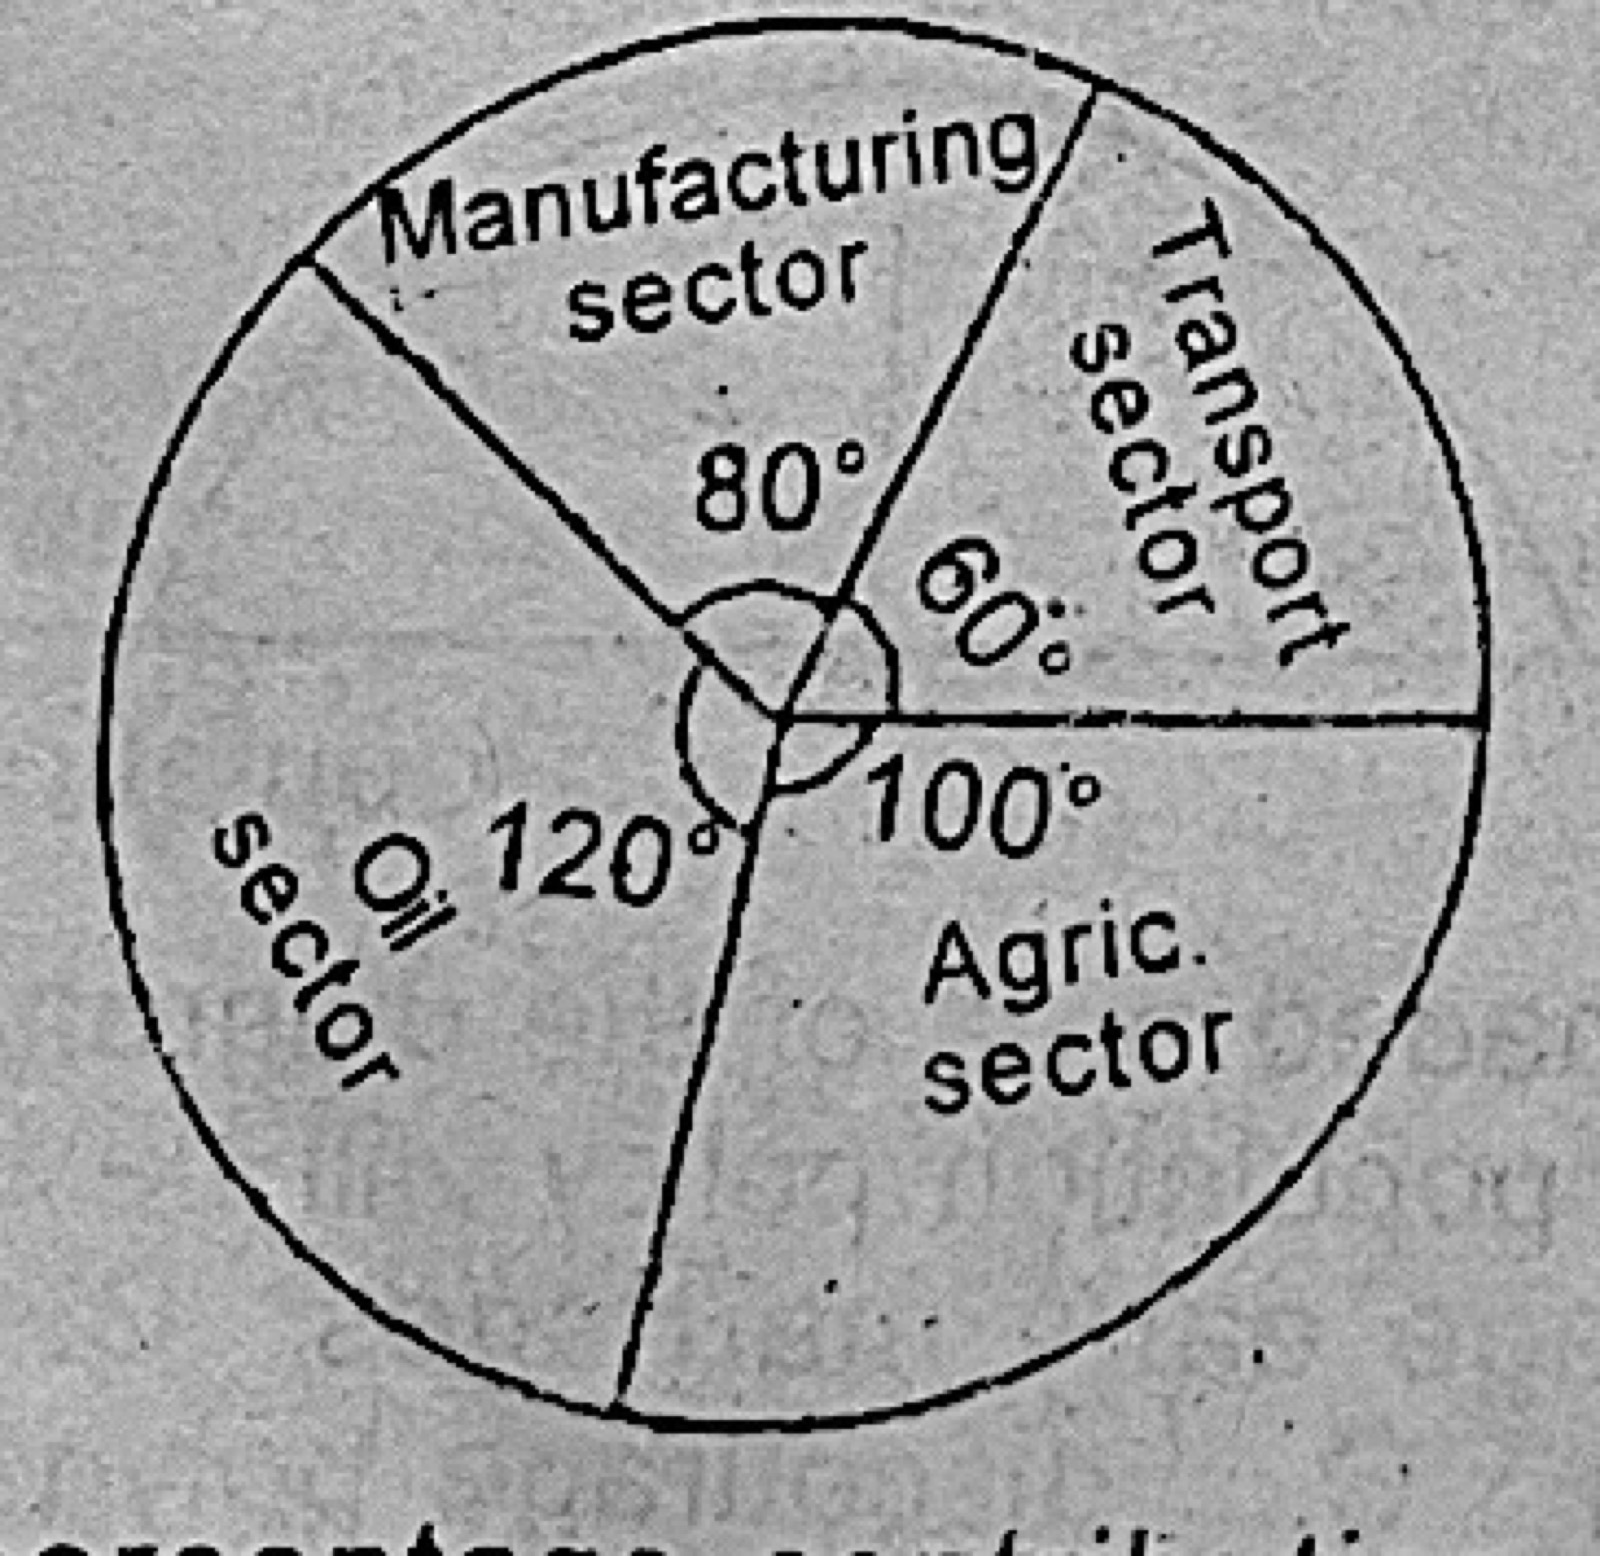
Tools of Economic AnalysisUse the pie chart below to answer questions 4 and 5. The percentage contribution of the transport sector is
- A.600.0
- B.166.7
- C.60.0
- D.16.7
Show the answer and explanation
Answer: D (16.7)
Explanation
Transport has 60° of the 360° circle: 60/360 × 100 = 16.7%.