JAMB Biology 2016 past questions and answers

3 questions. Try each one, then open the answer to check yourself and read the explanation.

Question 15

Population Ecology

Use the graph of population size of a given species against temperature to answer: The zone of physiological stress is represented by
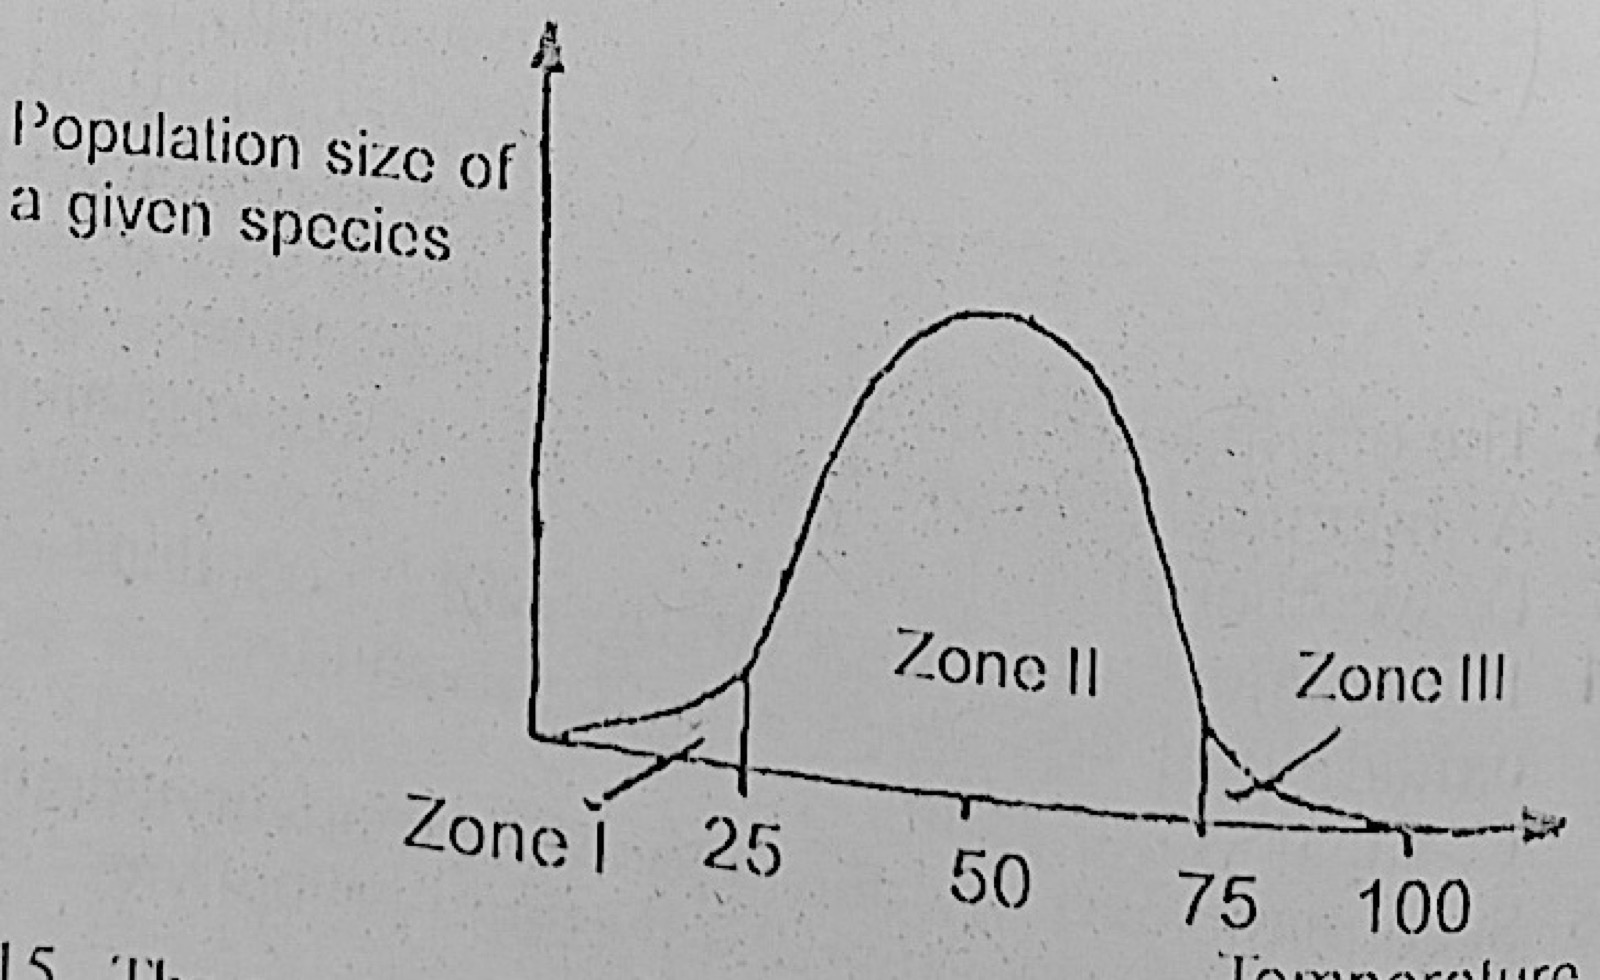
Diagram for this question
  1. A.I and II
  2. B.II only
  3. C.II and III
  4. D.I and III.
Show the answer and explanation

Answer: D (I and III.)

Explanation

Zones I and III are the temperature extremes where only a few individuals survive, so the organisms there are under physiological stress. Zone II is the optimum range.
Open this question

Question 16

Population Ecology

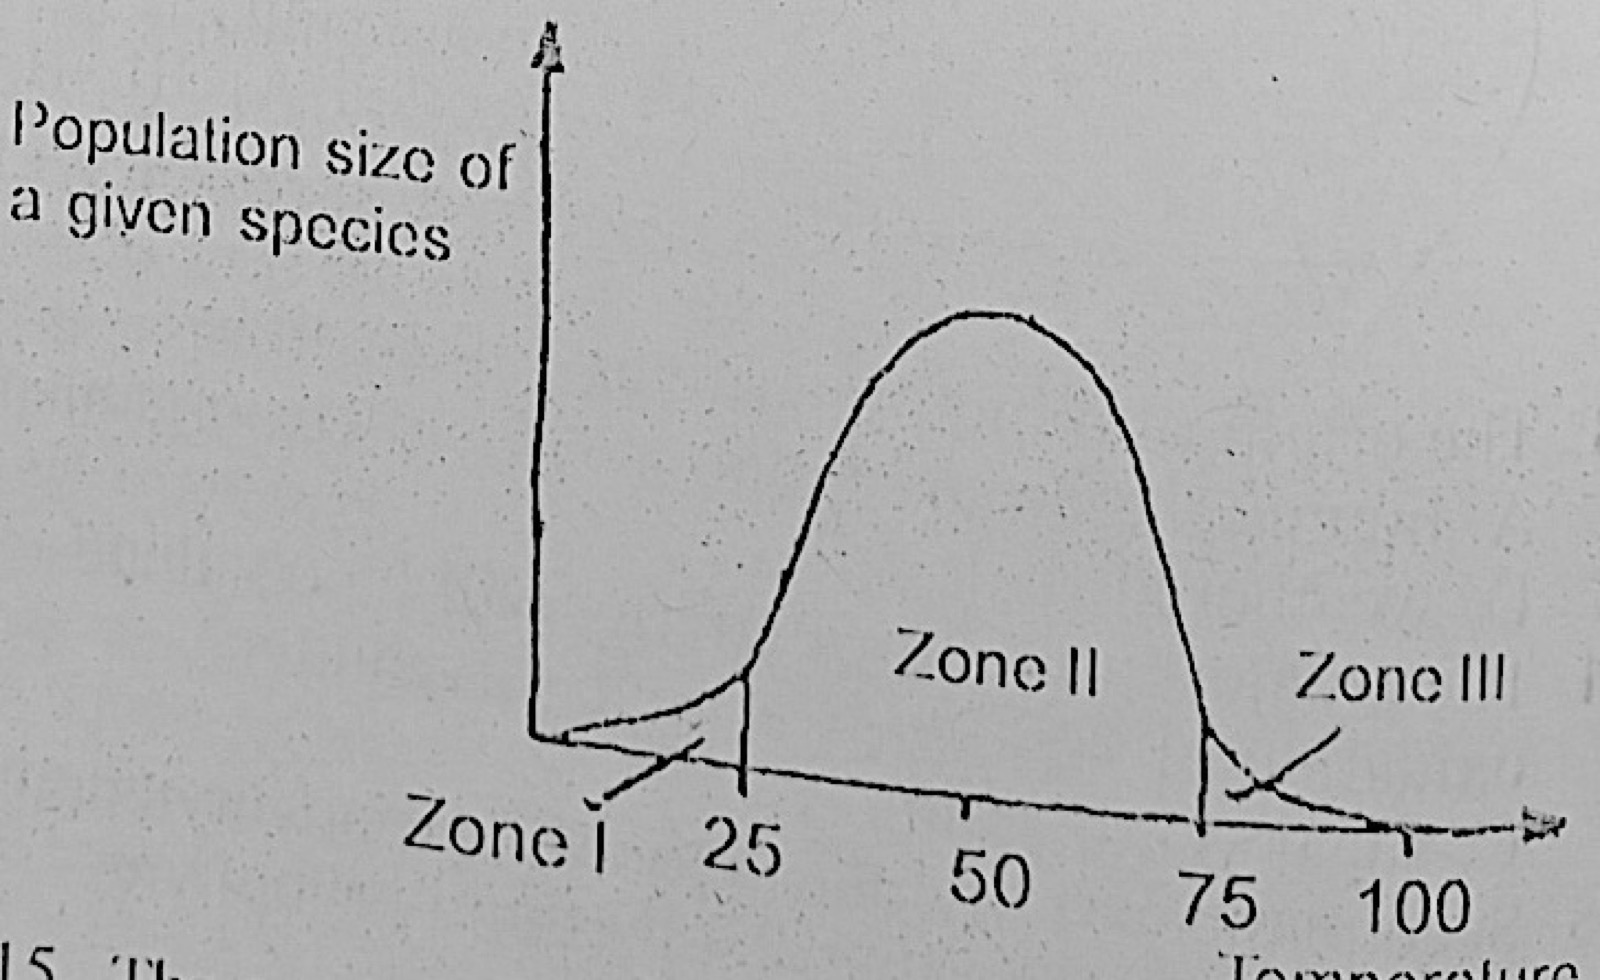
Use the graph of population size of a given species against temperature to answer: The optimum temperature for the growth of the organism is

Diagram for this question
  1. A.25°C
  2. B.50°C
  3. C.75°C
  4. D.100°C.
Show the answer and explanation

Answer: B (50°C)

Explanation

The population is largest at the peak of the curve, which is at about 50 °C, so that is the optimum temperature.

Open this question

Question 30

Soil

Erosion can be reduced along a slope by

  1. A.ridging across slope
  2. B.ridging up slope
  3. C.ridging down slope
  4. D.crop rotation.
Show the answer and explanation

Answer: A (ridging across slope)

Explanation

Ridges made across the slope (contour ridging) stop rain water from running straight down and carrying soil away.

Open this question